Hedge funds turn bullish
The Predictive Investor - 3/16/25
Welcome to The Predictive Investor weekly update for March 16th, 2025!
Last week’s economic news supported the bullish case - inflation lower than expected, job openings higher than expected, and jobless claims lower than expected.
And yet sentiment indicators of all kinds indicate a deeply pessimistic outlook.
Still, I continue to be a buyer of stocks, and there were some constructive developments last week from a technical perspective.
Here’s my takeaways from the week.
Institutional traders turn bullish
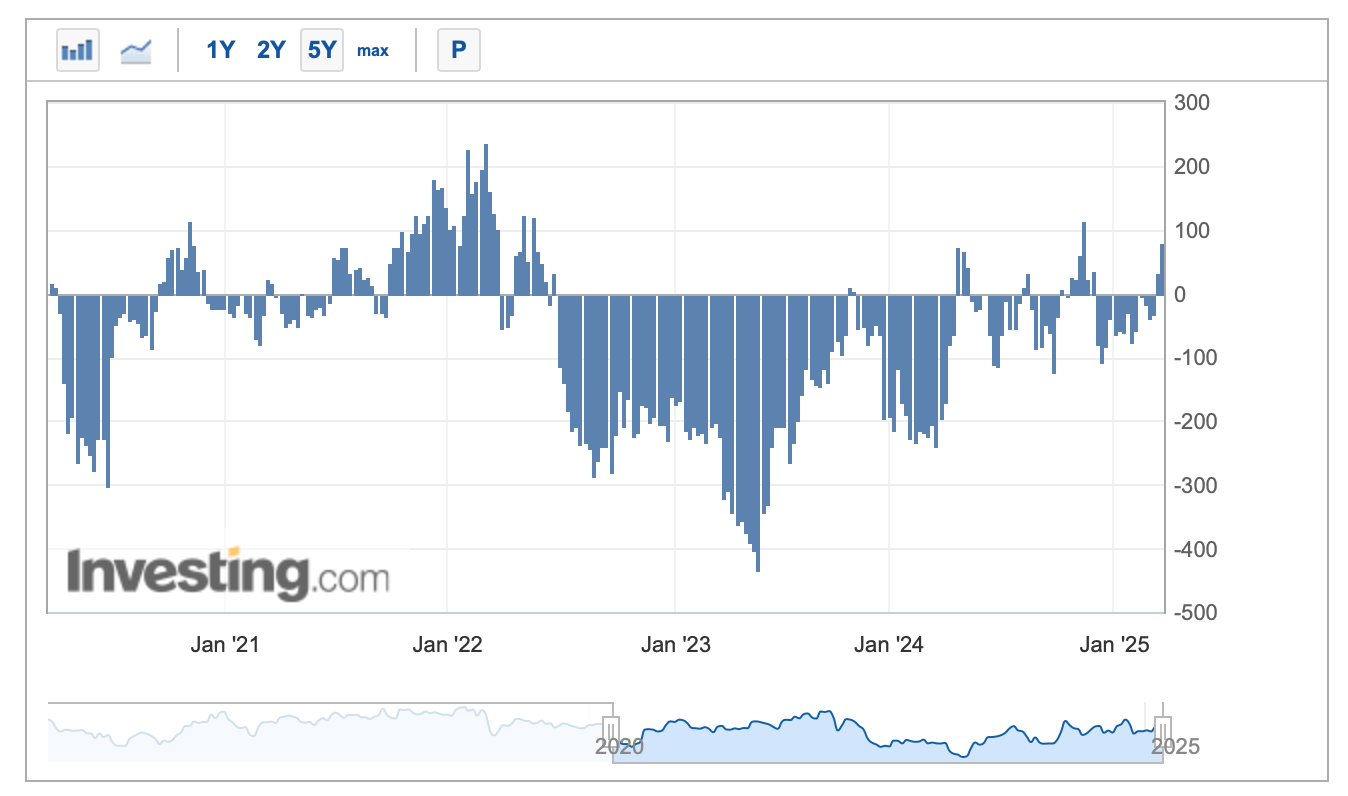
Hedge funds and other speculators are net bullish on the S&P 500 for the second week in a row, after being net bearish for 14 weeks. This is a clear sign that there are few sellers left.
The market has priced in all the negative news around tariffs and a slowing economy. The bar for a positive surprise is now very low.
Bearish advisors outnumber bulls
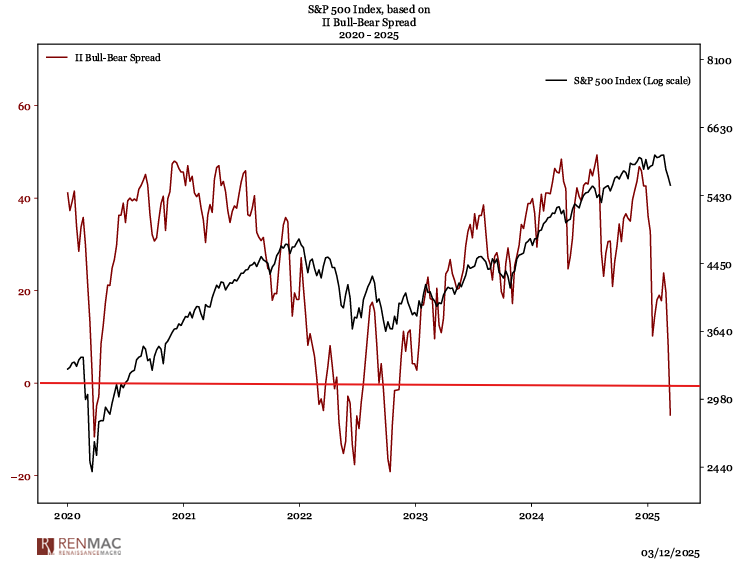
I previously highlighted extreme pessimism in the AAII investor survey. The Investors’ Intelligence survey has been around much longer, and measures advisor sentiment. The latest survey shows bears now outnumber bulls for the first time since the market bottom in 2022.
The signs that we’re at peak pessimism continue to pile up. Waiting until it feels good to buy stocks means passing up some incredible discounts.
My own approach is to dollar cost average into the market during corrections. That allows me to take advantage of lower prices without attempting to time the exact bottom.
One of the fastest declines in history
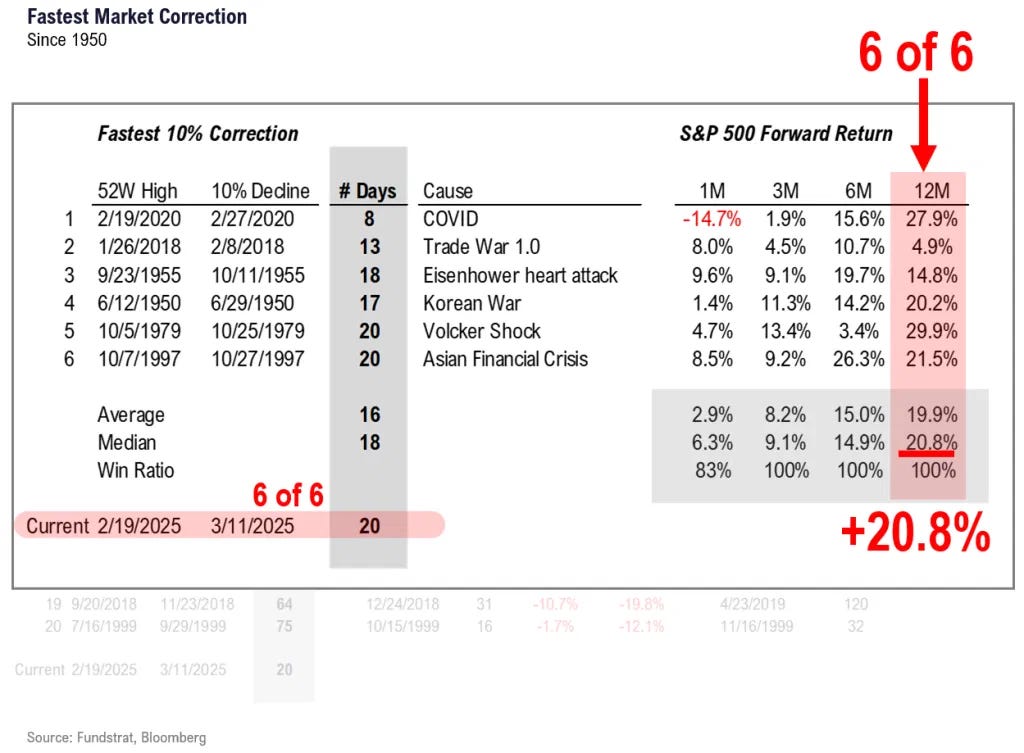
Part of this reason sentiment indicators are so extreme is that the selloff occurred so quickly. In fact, the recent decline is among the fastest corrections for the S&P 500 since 1950.
The good news is fast selloffs have been excellent buying opportunities, with the market moving higher 3, 6 and 12 months later 100% of the time.
Technical indicators show signs of mean reversion
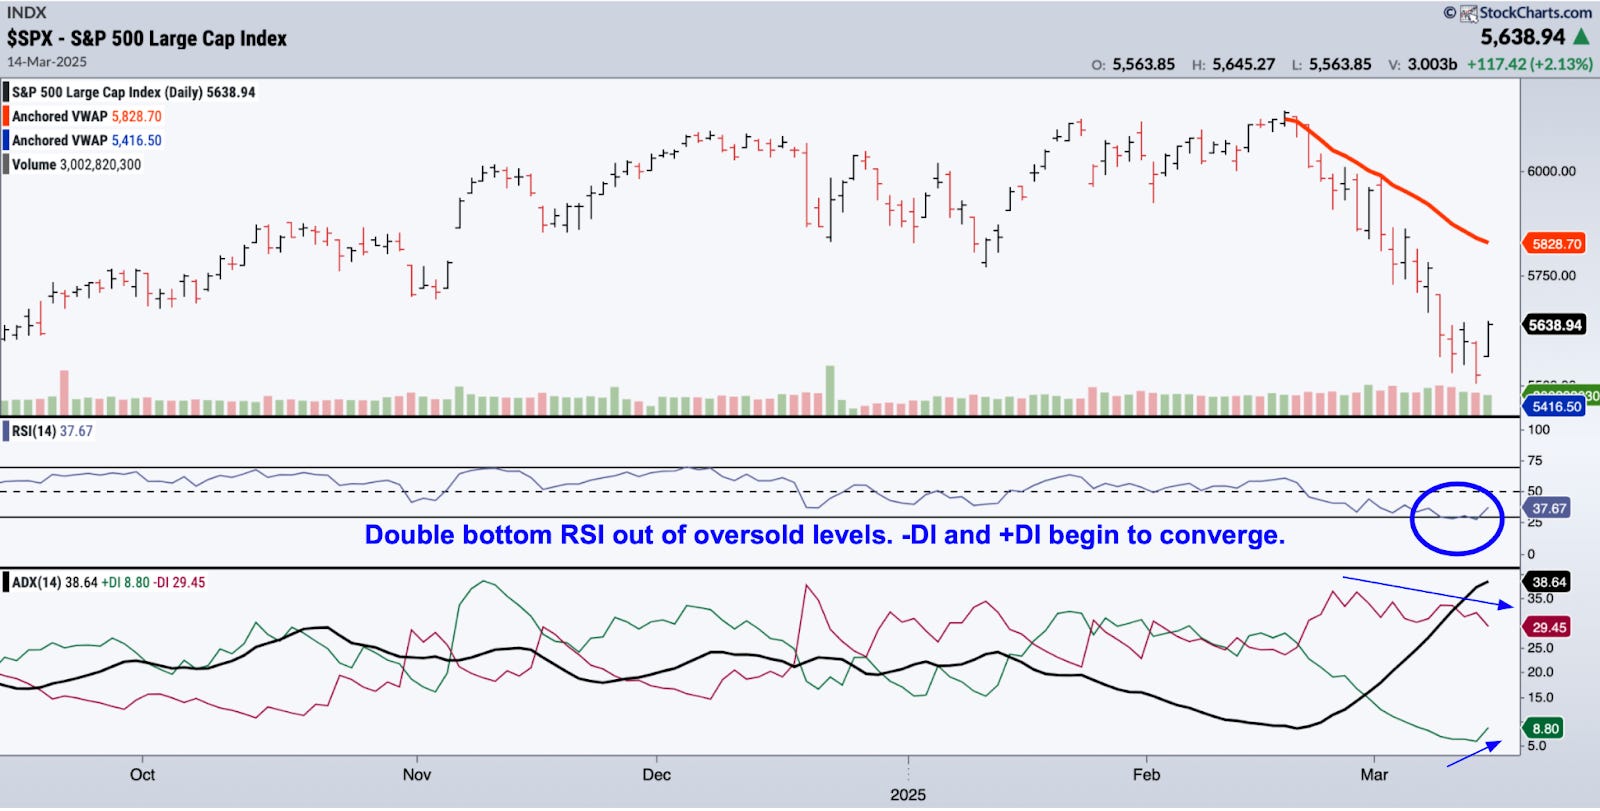
My view on when to call the end of these kinds of corrections has always been to keep it simple and let the market lead the way. This means the bears are in control until a decisive close above the anchored VWAP from the February 19th high (currently at 5,828.70).
That said, technical indicators are showing signs of reversing out of bearish territory. The RSI put in a double bottom and reversed out of one of the most oversold readings since 2023. DI- has been trending down for a couple weeks, and this week DI+ started to turn up.
This is all consistent with our assessment that the selling is overdone and the market is in the process of bottoming out.