Market Brief - April 30, 2023
Stocks rallied higher last week, driven by solid earnings results. Most of the S&P 500 companies that have reported so far have beat consensus EPS estimates. While there has been near-universal consensus that a recession is imminent, strong earnings and a relatively low unemployment rate have defied bearish expectations.
The market expects the Fed to hike rates 25 basis points on Wednesday, and we will likely see increased volatility if Powell gives any firm indication of future rate hikes.
Russell 2000 (IWM)
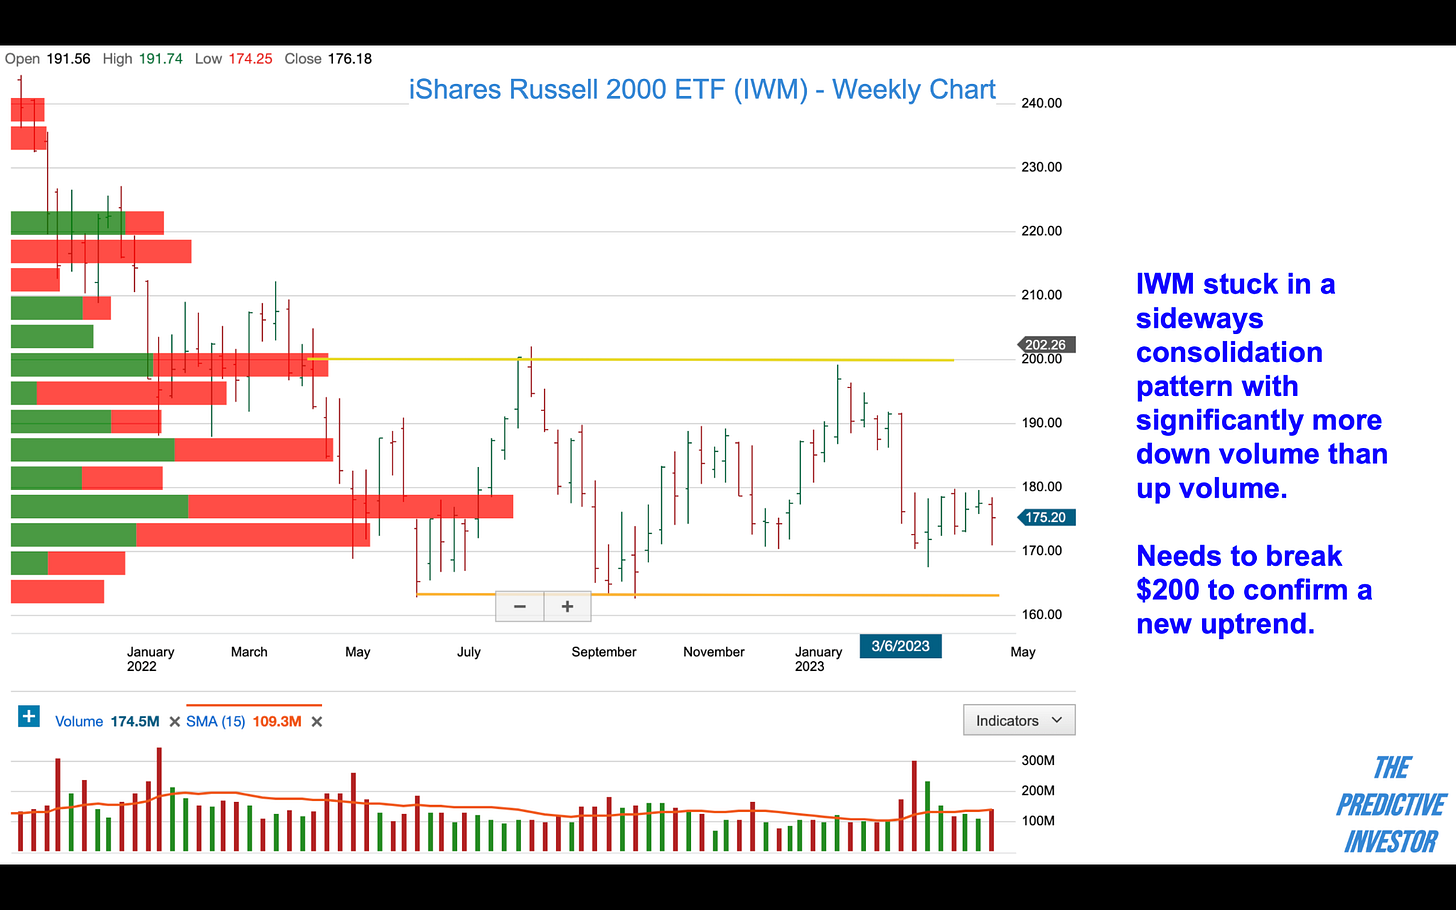
Small cap weakness continues to persist with the Russell 2000 stuck in a sideways consolidation pattern. Volume started to pick up with the rally on Thursday and Friday. The first clue to a potential trend change will be price and volume action at $180. Ultimately we’ll need to see a decisive rally past $200 to confirm a new uptrend.
Nasdaq (QQQ)
Positive earnings results from mega cap tech companies continued to fuel the Nasdaq rally. With a 27% increase from its October lows, QQQ is technically in a bull market. AI dominated the conversation during big tech earnings calls, and it’s clear the technology will drive the next wave of innovation. It will also be highly disruptive to white collar jobs.
New bull markets are typically driven by new technologies, and this market clearly wants to go higher. But we will need to see some confirmation from the other market indexes to buy this market more aggressively.
Dow Jones Industrials (DIA)
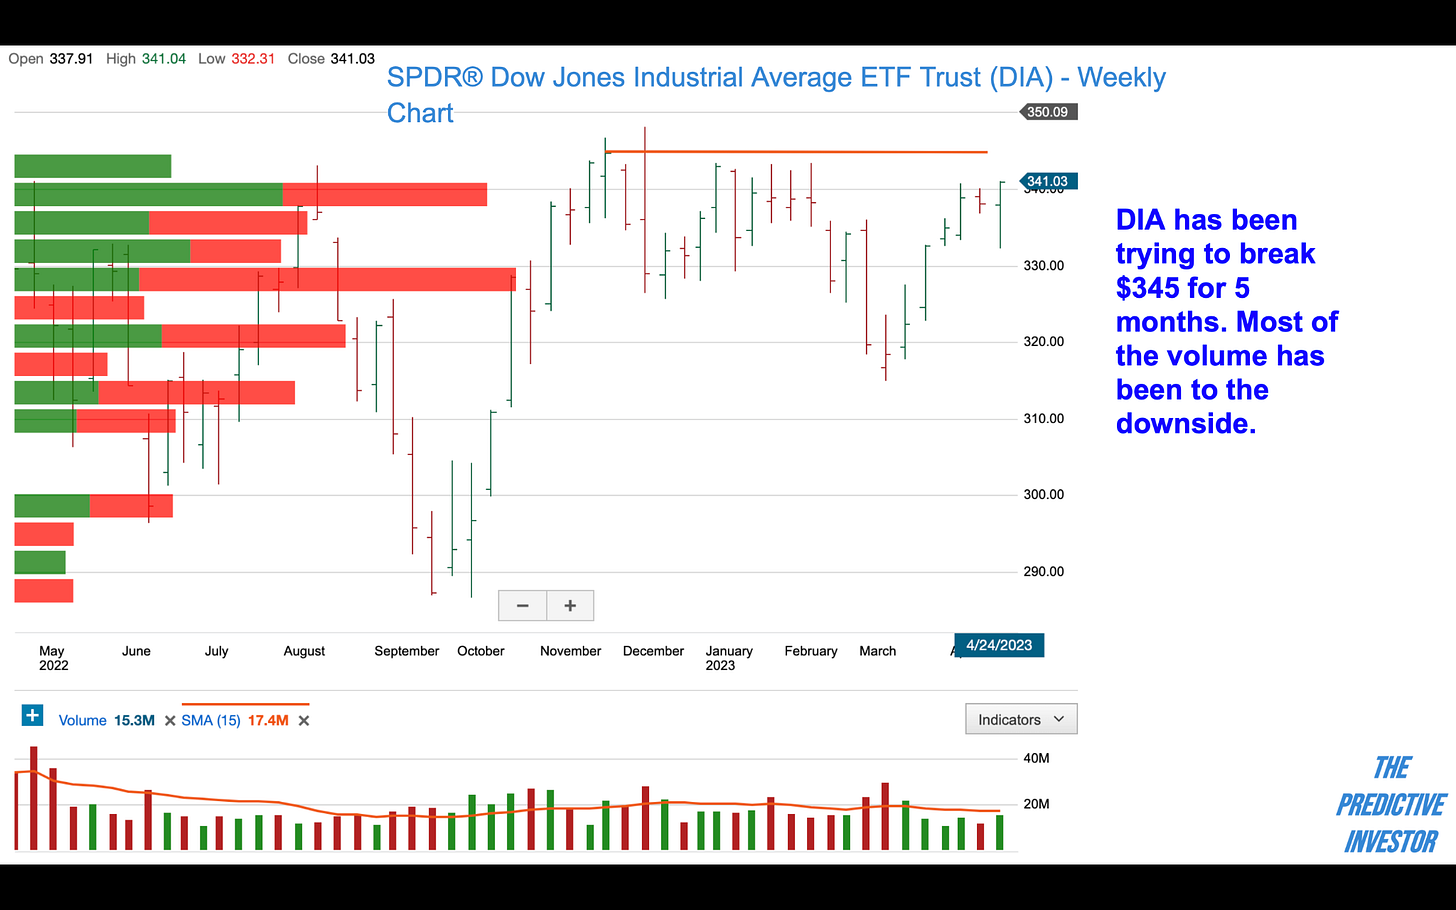
DIA has consistently failed to break $345 resistance for 5 months. This week’s close established a weekly bullish reversal bar on slightly higher volume. But overall volume is down since the consolidation pattern started back in November. Again, we’re looking to see price and volume align among the indexes to establish the next phase of this market.
S&P 500 (SPY)
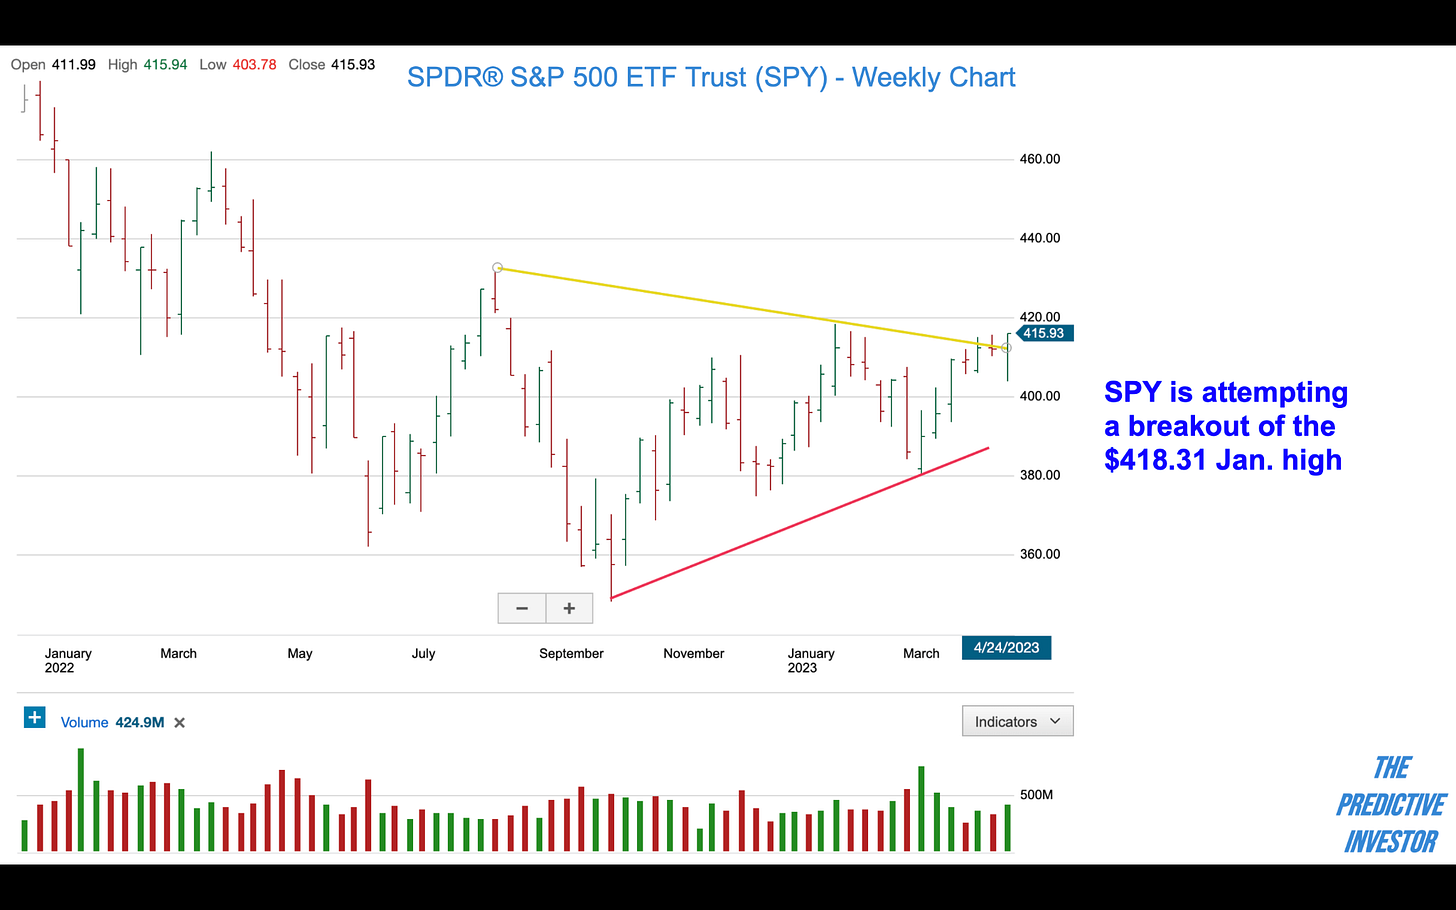
SPY is attempting to break above its January resistance. But this rally lacks conviction, with declining volume and very narrow participation.
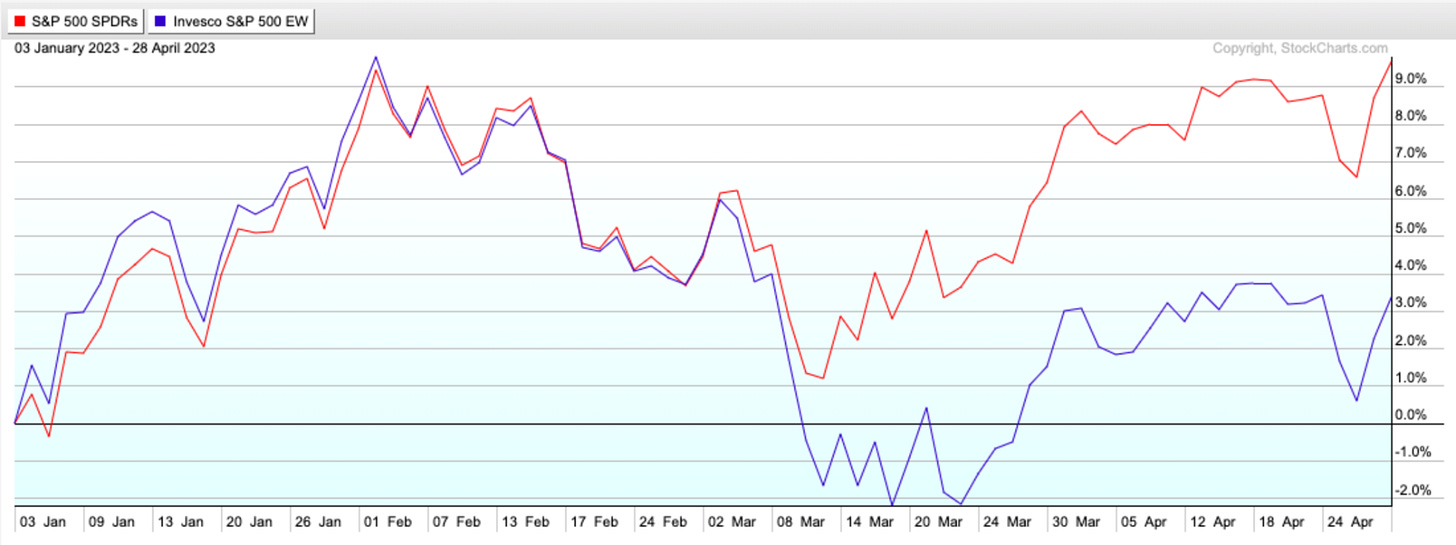
Barron’s reported that just six companies were responsible for 53% of the S&P 500 gains. This becomes obvious when you compare the market-cap weighted index with the equal-weight index, which allocates an equal weight for each component (see chart below). The equal-weight index is trailing far behind the market cap weighted index, indicating narrow participation and a lack of conviction in the continuation of this rally. Non-confirmation typically results in lower prices.
CBOE Volatility Index (VIX)
The VIX is now below the level it was in Jan. 2022 when the market topped, and below its long term average. Volatility tends to be mean reverting and seasonally May tends to be a weaker month for stocks. With yet another bank set to fail and the prospect of a standoff over the debt ceiling, there seems to be more risk to the downside at the moment.


