
Market Brief - August 13, 2023
Welcome to The Predictive Investor Market Brief for August 13th, 2023!
Stocks continued their decline, led by the Nasdaq (down 1.9%) and the Russell 2000 (down 1.7%). The Dow eked out a tiny gain, while the S&P 500 declined by 0.3%. This was mostly due to a rotation out of big tech into industrials, energy and healthcare.
Economic news for the week was mixed: CPI met expectations, but PPI came in higher than expected, mostly due to rising energy prices. Jobless claims also came in higher than expected. While not at recession levels, this does indicate a softening of the labor market, which is what the Fed was hoping to see.
Very little market-moving news slated for next week. Retail sales numbers will be released on Tuesday, and Home Depot, Target and Walmart all report earnings next week. Taken together if these numbers align we could see a big move in the Dow. Mixed results will give us continued consolidation.
Weekend Reads
Generative AI Is Exploding. These Are The Most Important Trends To Know: Generative AI has turned many assumptions on their head. In the early days we thought AI would replace manual work, but robotics turned out to be harder than some parts of cognitive knowledge work. And, equally surprising, the approximate nature of generative models makes them better than expected at creative work and less than completely trustworthy on rote, mechanical tasks. Achieving artificial general intelligence, that futuristic self-learning system that some fear could threaten humanity, is still a moving target. But there can be no doubt that the progress of large language models over the past year has been transformative—and their applications increasingly general. (Sequoia)
AI has rapidly replaced crypto and virtual reality as the next big thing to drive growth, and big tech has a clear head start, with massive amounts of data at their disposal to refine their models. Corporate boards have been pushing companies to have an AI story for investors. But with everyone rushing in to leverage AI, investors should be cautious. The companies that will win over the long term will need to offer a sustained competitive advantage. Our favorite AI play right now is Palantir (PLTR). Many companies have restricted employees from using widely available generative AI tools, and Palantir offers a secure way for organizations to leverage some of the benefits of AI in conjunction with their own data and proprietary systems.
India’s Economy Is Humming, and There’s More to Come. Here’s How to Profit. India recently overtook China to become the world’s most populous country, and its economy is booming after years of setbacks. (Barron’s)
This was supposed to be the Chinese century, but we’re off to an uninspiring start. The iShares China ETF is back to where it was a decade ago. China’s post-Covid recovery has been anemic, and the Chinese government does not seem interested in pursuing market-oriented strategies to improve their economy. The current narrative around India reminds us of the argument for investing in China back in the early 2000s. Time will tell if the hype translates into superior returns. But a safer way of investing in population growth is through Australia, a chief supplier of natural resources to both countries. The iShares Australia ETF (EWA) currently yields 3.62%.
What Does an Inverted Yield Curve Tell Us? If you looked at a chart of the yield curve (YC) in the USA you’d be absolutely convinced that this indicator is a recession predictor. After all, it has a nearly flawless track record predicting recessions in the USA. But if you looked outside the USA the data is much more mixed. This 2010 NBER paper found that the yield curve is not as predictive as you might think if you only looked at US data. (Discipline Funds)
The media will dedicate substantial energy in the coming weeks and months to explaining why the U.S. avoided a recession. We maintain that the first 2 quarters of 2022 constitute a recession that will never officially be called.
The (In)Accuracy of Market Forecasts: A large body of evidence demonstrates that market forecasts from 'gurus' have no value in terms of adding alpha. For investors who haven’t learned that such prognostications should only be considered entertainment, or what Jane Bryant Quinn called “investment porn,” they, in fact, have negative value because they can tempt investors to stray from well-developed plans. (WealthManagement.com)
Don’t confuse research with marketing material. Forecasts are typically issued in order to generate PR. Even Jeremy Grantham admitted his firm did not completely abandon equities in 2022, despite his forecast for a substantial decline in stock prices. If you learn one thing from this newsletter, we hope it’s the importance of sticking to a rules-based approach for selecting stocks.
Market Technical Analysis
S&P 500 (SPY)
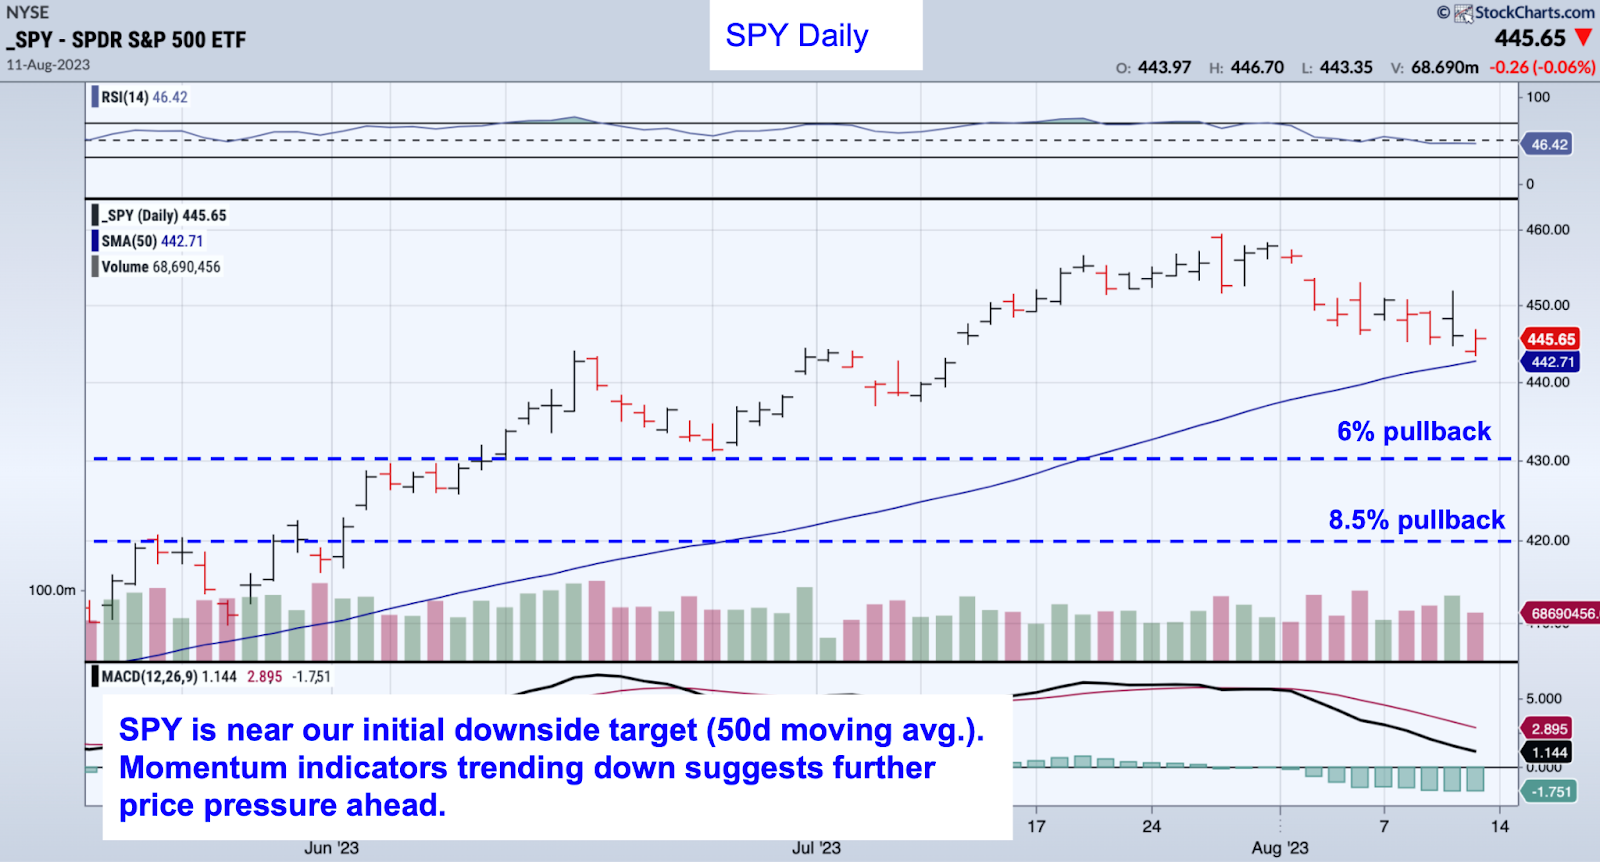
SPY has declined near our initial downside target at the 50-day moving average (currently $442.71). QQQ has already broken below its 50-day moving average, and given the rotation out of tech we think there’s more downside ahead. Since 1950, the average correction after a 15%+ rally in the S&P 500 has been -8.2%. With RSI and MACD in downtrends, we’re targeting a 6-8% correction from the July high.
Russell 2000 (IWM)
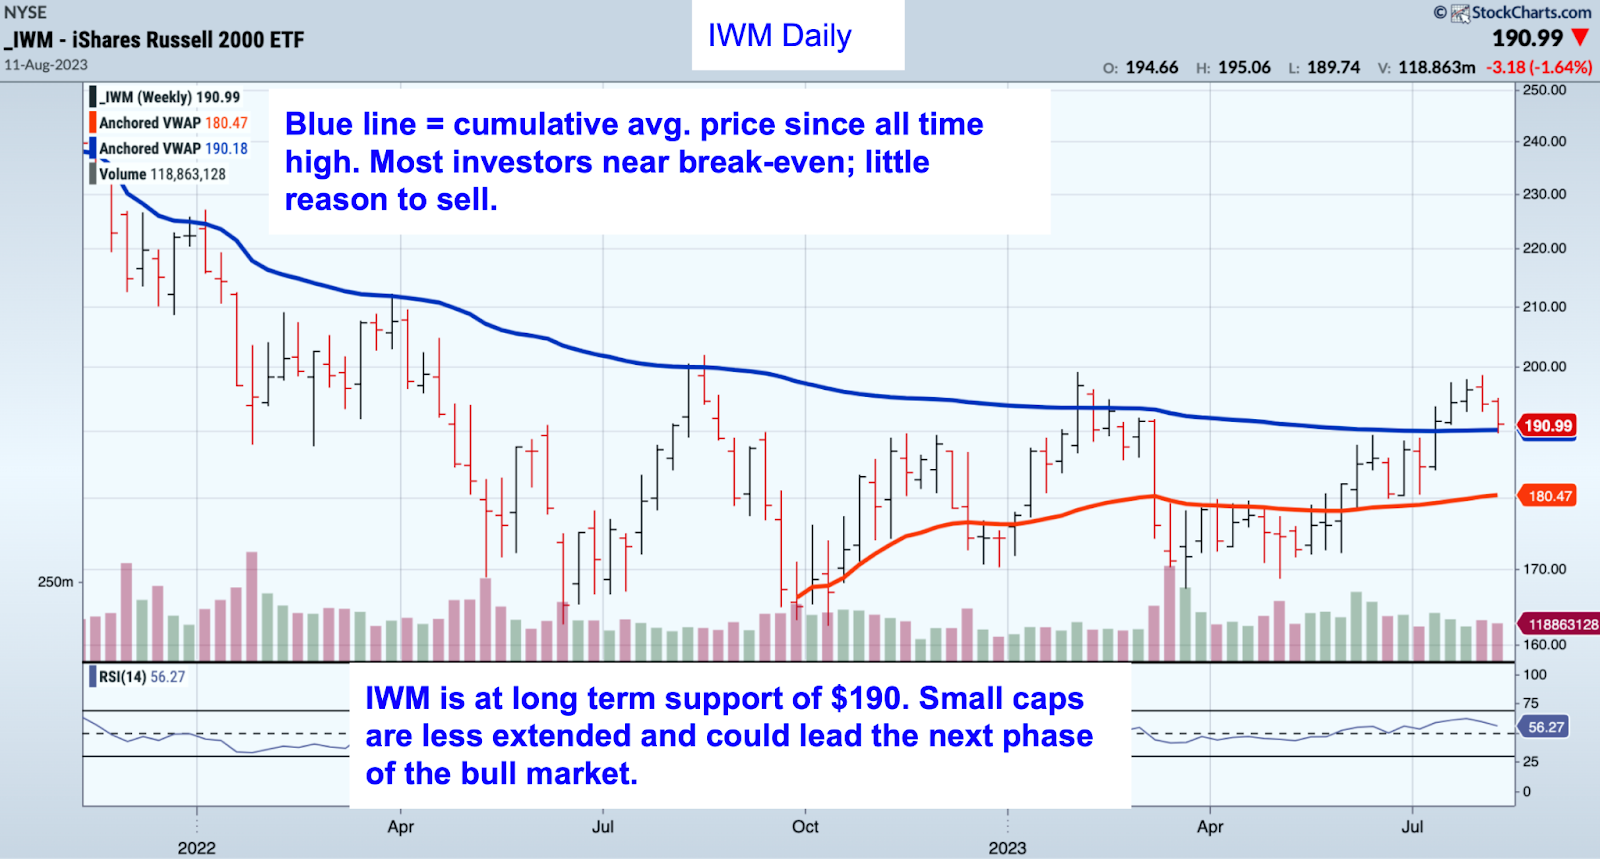
IWM closed the week at the 11/1/21 AVWAP, which represents the cumulative average price of all shares traded since the index topped in 2021. This is an important psychological level, as it means most investors are near break-even and have little reason to sell. If there is a stronger selloff, we could see a drop to $180, but we think such a scenario would represent a good buying opportunity.
Market Sentiment
Bullish sentiment in the investor sentiment surveys (CNN, AAII) has pulled back from its recent highs.
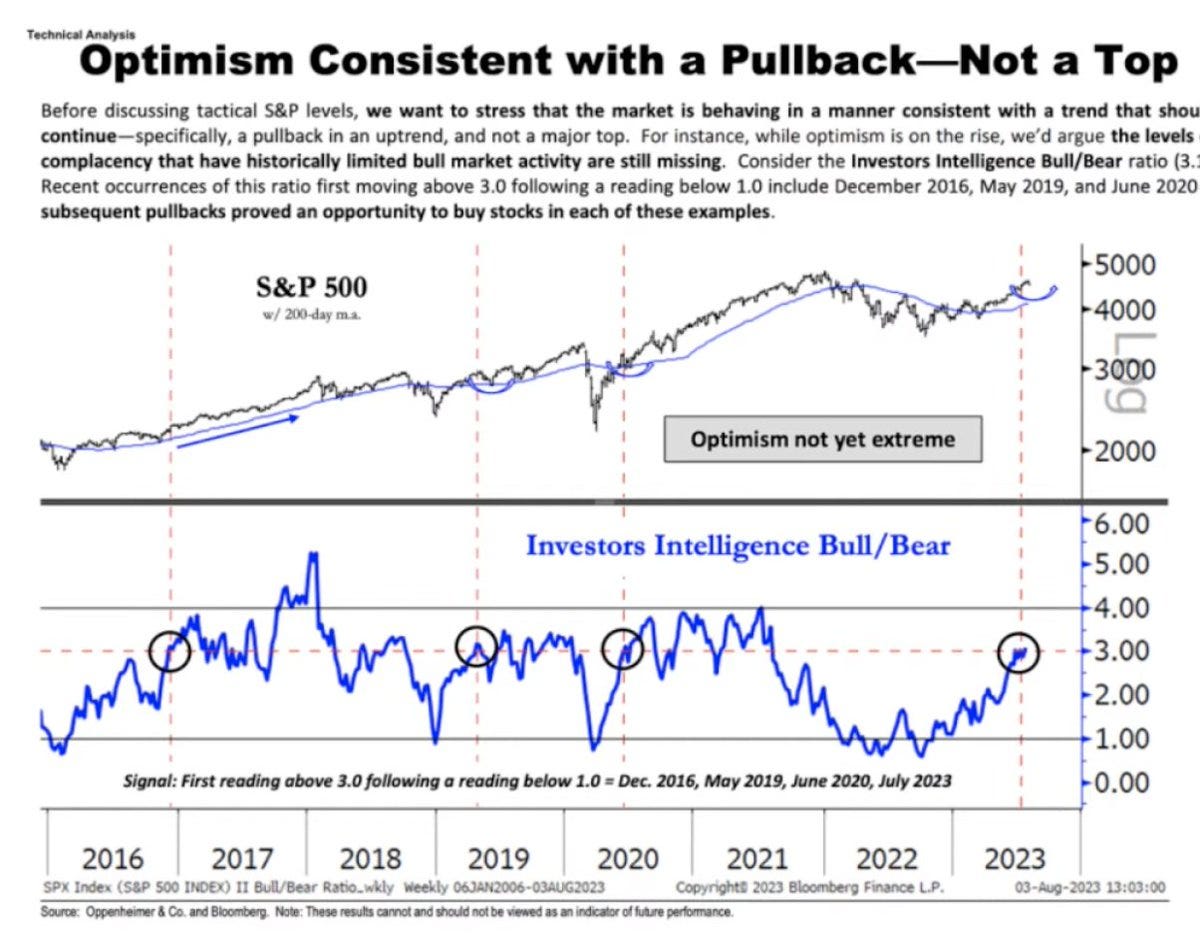
The Investors Intelligence survey is still near bullish extremes, but in the past these levels have been more consistent with a pullback than a deeper correction (chart below). Historically, when the bull/bear ratio goes from below 1 to above 3, the shift in sentiment is more consistent with a pullback than a longer term market top.
The bottom line: Waning momentum and a rotation out of tech suggest continued consolidation in the market indexes. Small caps are at solid support, and we will continue to add to the portfolio as opportunities arise.