
Market Brief - August 20, 2023
Welcome to The Predictive Investor Market Brief for August 20th, 2023!
Stocks continued their decline across the board, as better than expected retail sales were overshadowed by rising interest rates. The recent increase in long term rates provides investors the opportunity to rebalance portfolios and purchase fixed income investments at more favorable rates.
While small caps have begun to underperform, we do think the rotation out of tech and into industrials and energy will benefit our portfolio.
Weekend Reads
Performing Credit Quarterly 2Q2023: Fighting the Fed: The U.S. economy refuses to follow a single storyline. In the last six months, the gross domestic product has grown, while gross domestic income has contracted; the labor market has added jobs at a robust pace, but average hours worked have declined; and leading indicators have often disagreed with their lagging counterparts. This complexity may be a byproduct of the tug-of-war currently occurring between the U.S. federal government and the Federal Reserve. While they were closely aligned during the pandemic, they’ve often been working at cross-purposes over the last year, as the former’s desire to keep the economy churning has clashed with the latter’s interest in throwing sand in the gears. (Oaktree Capital)
Why We’re Not Too Worried About Rising Bankruptcies: One way to monitor this to look at spreads for “high-yield” borrowers. These spreads represent the interest rate premium that companies rated below investment-grade companies have to pay over risk-free Treasury interest rates. Typically, if investors expect economic hardship, and a higher likelihood of default, they will charge these companies higher interest rates on loans. That would result in larger spreads against Treasury rates. (Carson Group)
Market Technical Analysis
S&P 500 (SPY)
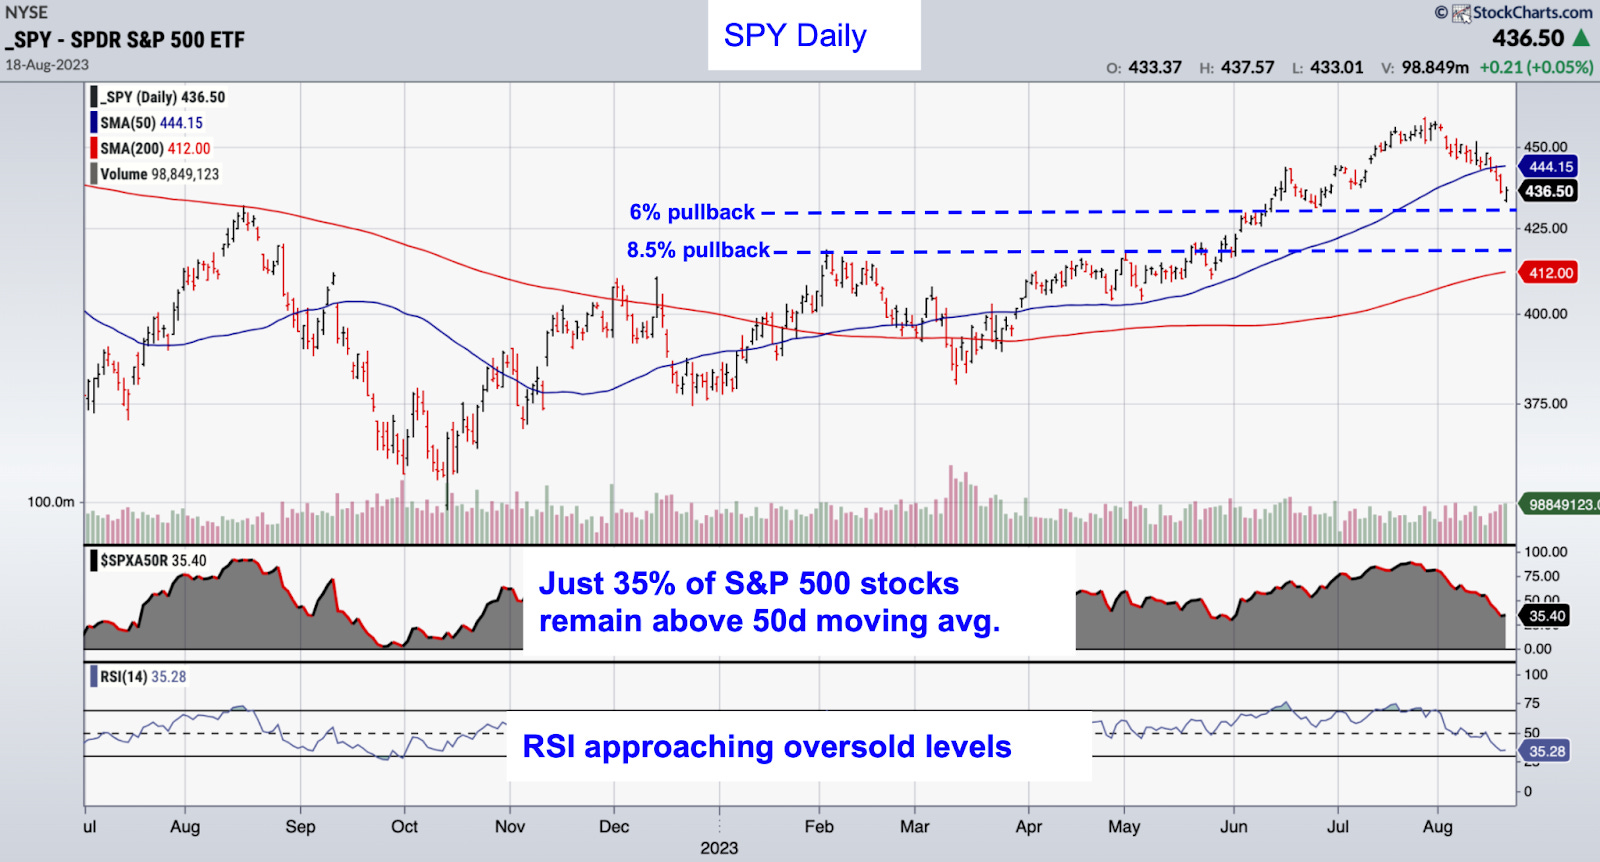
SPY has broken below its 50-day moving average and is fast approaching the 6%-8.5% pullback zone we’ve been targeting for the last couple weeks. RSI is approaching oversold levels, and appears to be flattening out. Just 35% of S&P 500 stocks remain above their 50-day moving average (down from 89% a month ago). Readings below 30% tend to coincide with reversals. This week we’ll be watching for price to stabilize while these indicators begin to flatten and reverse.
Market Sentiment
Bullish sentiment in the investor surveys (CNN, AAII) has pulled back dramatically from recent highs. The CNN Fear & Greed Index started the week at 70 and ended it at 45. Bullish sentiment in the AAII Investor Survey is below historical averages for the first time since May. When bearish sentiment trends above average, that will be a contrarian indicator that we are close to a reversal.
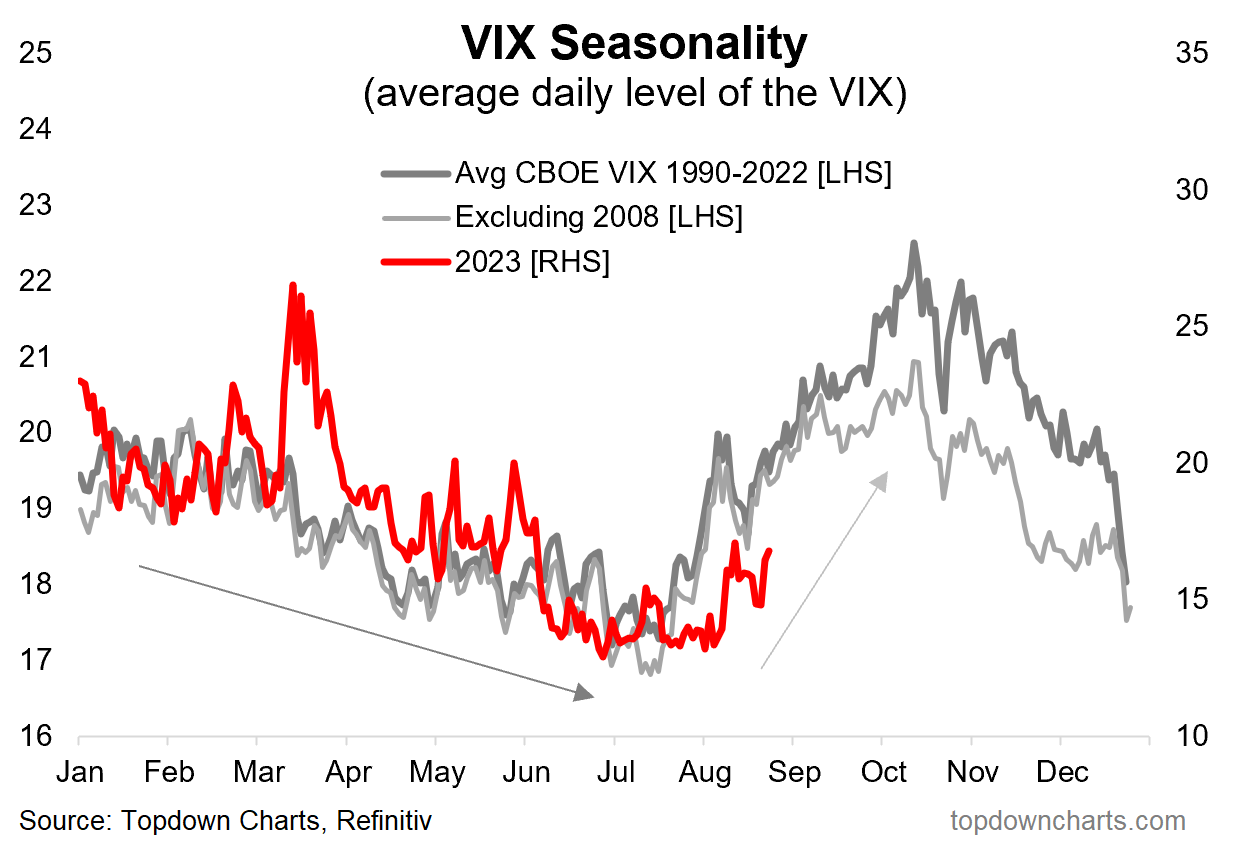
This is all against the backdrop of a rising VIX, which historically occurs late summer through mid-fall (chart below), suggesting we are likely to see increased volatility over the next few months.
The bottom line: While Nvidia earnings on Wednesday could rescue tech, for now the short term trend is down, and we expect continued consolidation ahead for the large cap indexes. The rotation out of tech into energy, financials, healthcare and industrials should continue to benefit our portfolio.