Market Brief - February 11, 2024
This rally is getting overextended
Welcome to The Predictive Investor Market Brief for February 11th, 2024!
The S&P 500 closed the week above 5,000 for the first time. From a technical perspective this number is unimportant. But it is an important psychological threshold that could lead to further short term upside, proving once again that timing a correction is exceedingly difficult. The red flags we’ve been warning about continue to persist: extreme bullishness, overbought RSI, declining breadth, and unfavorable seasonality.
Our strategy doesn’t need to time the exact high and low. We simply initiate more positions when the market is oversold than when it is overbought. So we will continue to trade lightly and watch how this unfolds.
Weekend Reads
The U.S. economy is booming. So why are tech companies laying off workers? (The Washington Post)
“Wall Street’s sell-off of tech stocks in 2022 pushed companies to win back investors by focusing on increasing profits, and firing some of the tens of thousands of workers hired to meet the pandemic boom in consumer tech spending. With many tech companies laying off workers, cutting employees no longer signaled weakness. Now, executives are looking for more places where they can squeeze more work out of fewer people.”
The Seven Laws of Pessimism (Quillette)
“Every good editor knows that “if it bleeds, it leads.” If the newspapers only focus on awful things and ignore all the good stuff, is it any wonder that people end up believing that the world is going down the drain?”
Three AI insights for hard-charging, future-oriented smartypantses (Pluralistic)
“Over and over, the claims of AI pitchmen turn out to be blatant lies. This has been the case since at least the age of the Mechanical Turk, the 18th century chess-playing automaton that was actually just a chess player crammed into the base of an elaborate puppet that was exhibited as an autonomous, intelligent robot.”
The Rooftop Solar Industry Could Be on the Verge of Collapse (Time)
“Since at least 2016, big solar companies have used Wall Street money to fund their growth. This financialization raised the consumer cost of the panels and led companies to aggressively pursue sales to make the cost of borrowing Wall Street money worth it. National solar companies essentially became finance companies that happened to sell solar, engaging in calculations that may have been overly optimistic about how much money the solar leases and loans actually bring in.”
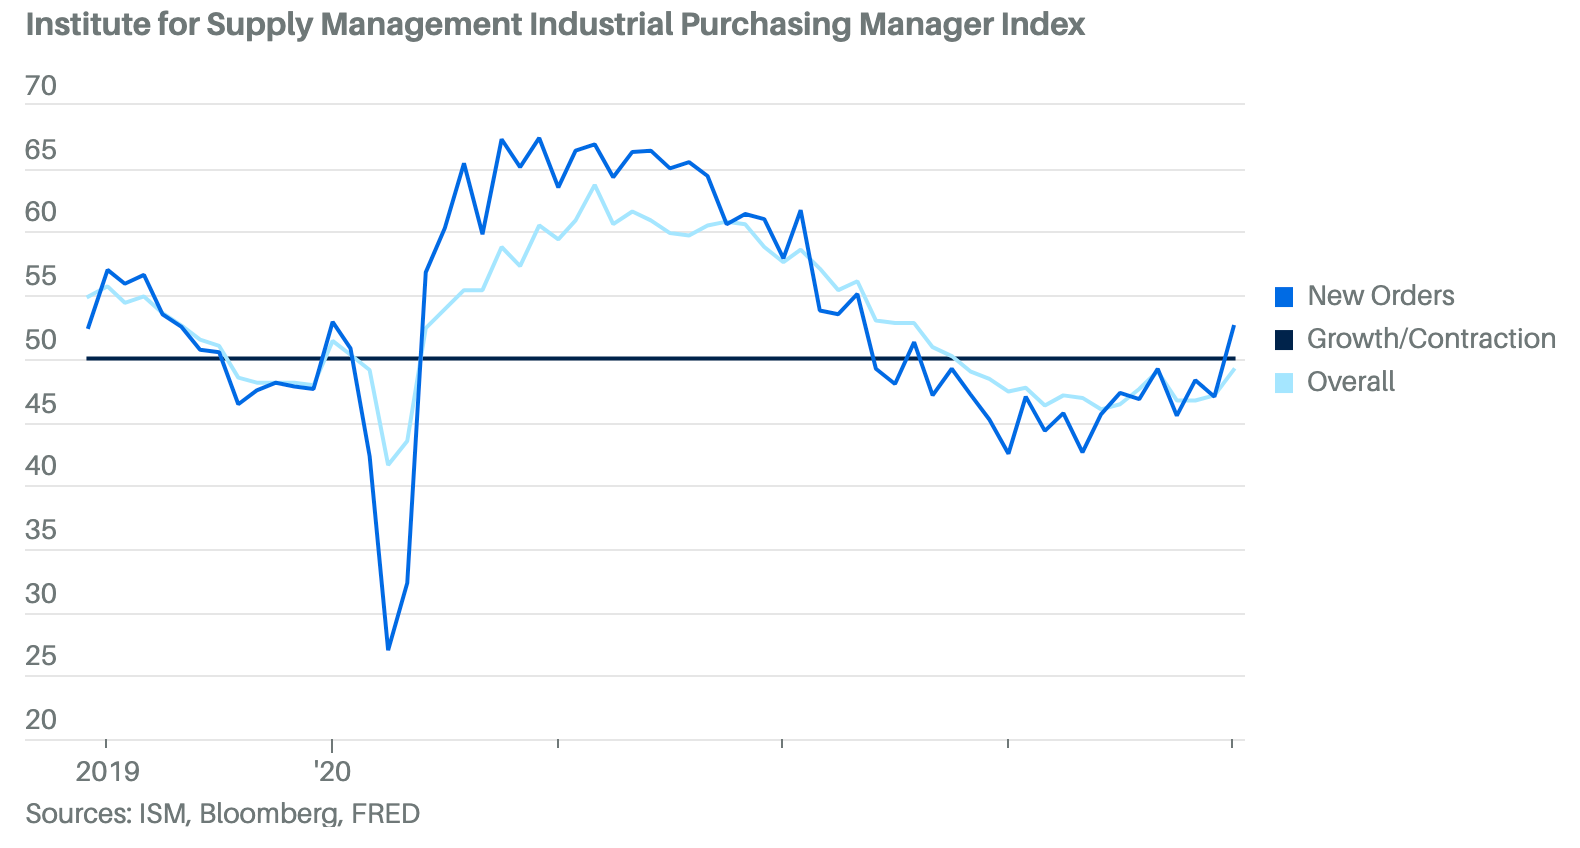
ISM Manufacturing Index Shows Signs of Improvement (Barron's)
Market Technical Analysis
S&P 500 (SPX)
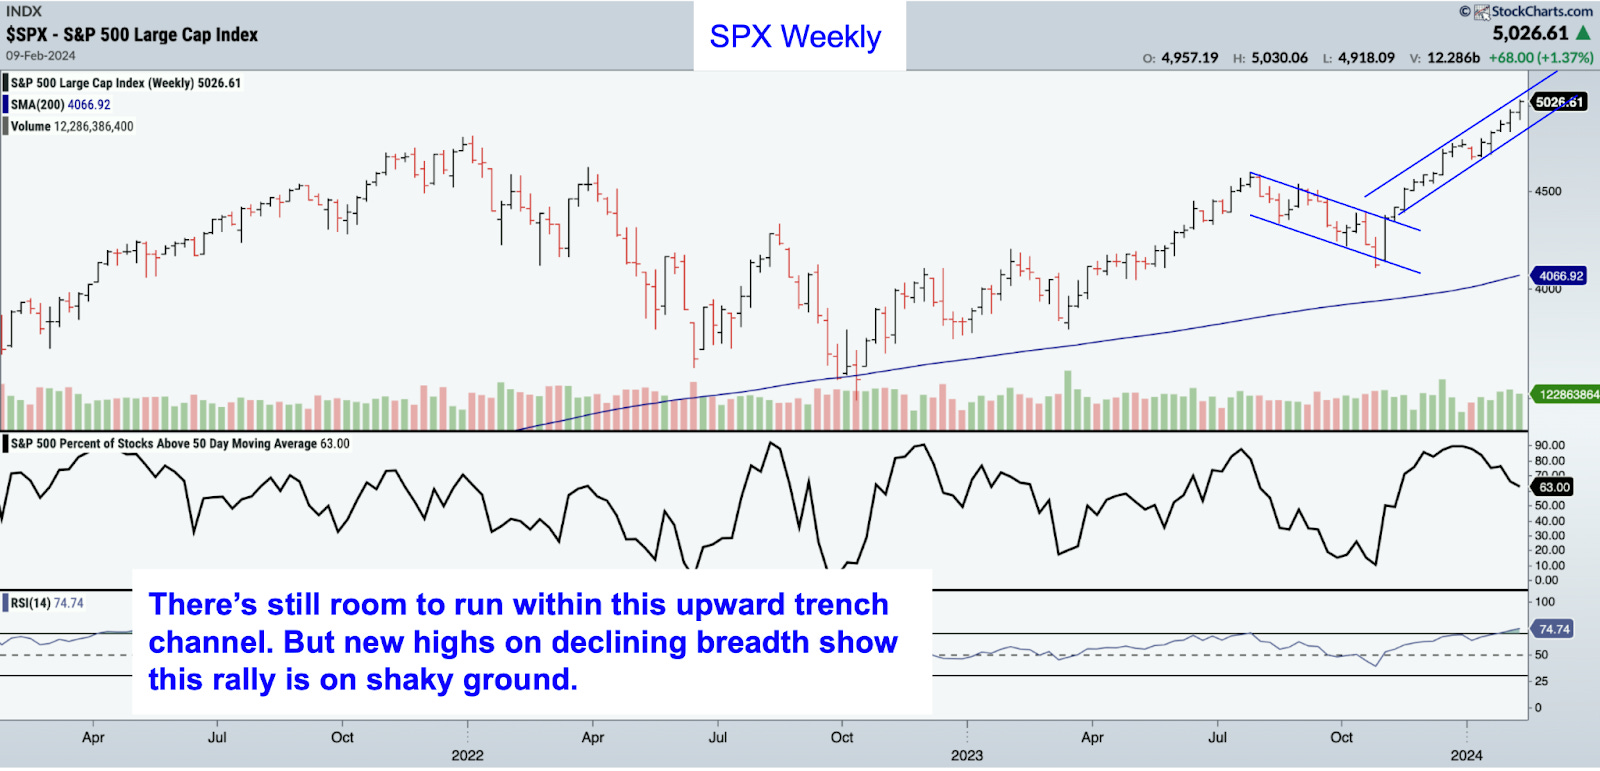
The SPX has been trending up in a price channel since last November, and in the short term there is still room to run. But declining breadth shows there are cracks beneath the surface of this rally. RSI has spent 3 weeks in overbought territory on the weekly chart. The last time that happened was in April 2021. But the key difference was the breakout to new highs back then coincided with expanding breadth. This time around fewer and fewer stocks are making new highs along with the market.
Intermarket Analysis
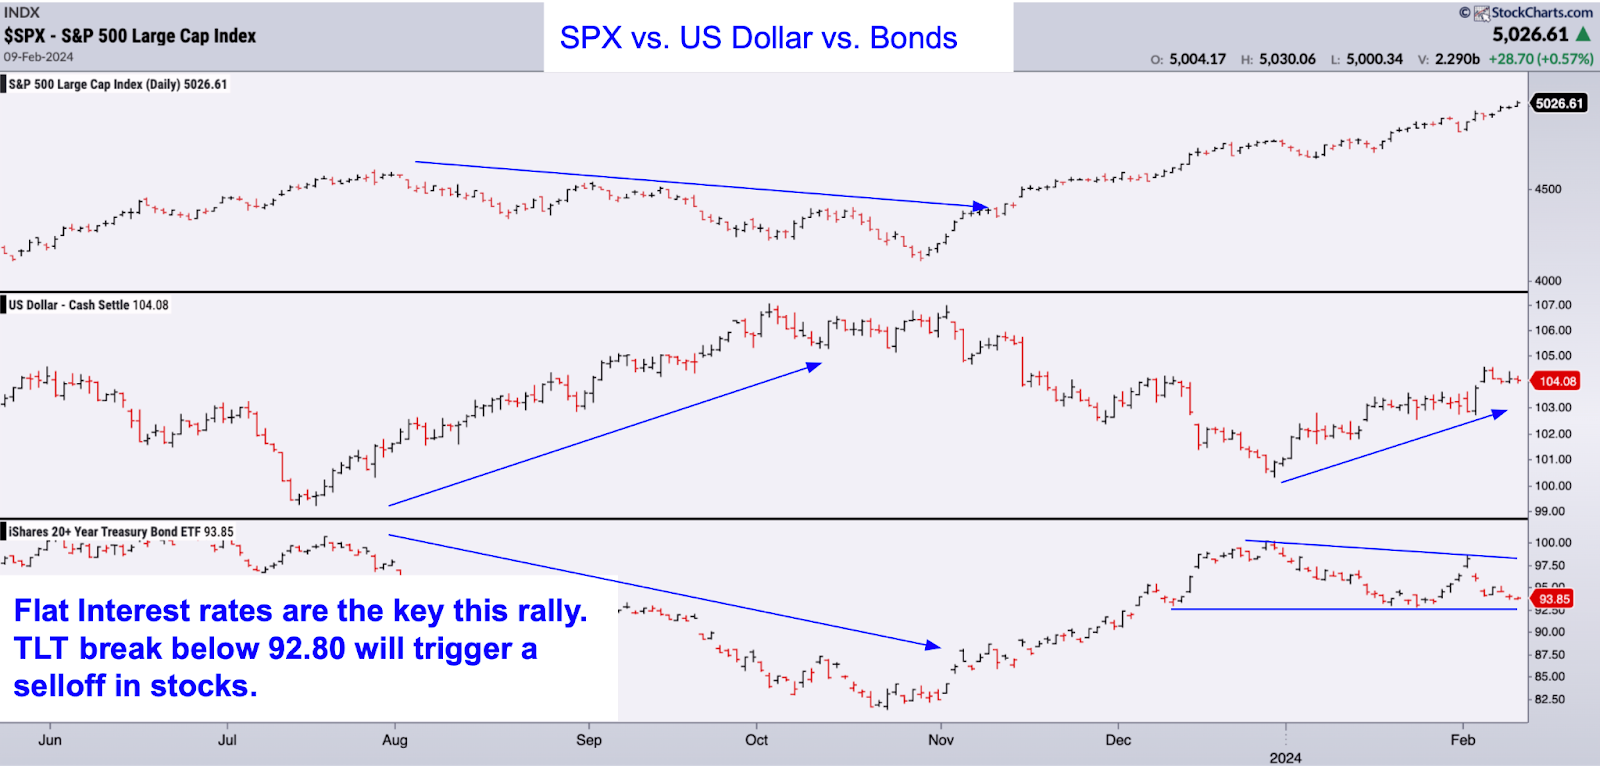
Let’s revisit our intermarket chart from last week. The dollar has continued to trend higher as we expected. But rates have been flat for a few weeks. Flat (or declining) rates are the key to maintaining this rally. As long as traders can invest at a higher rate than the cost of money, stocks go up. We’ll be watching TLT closely. A breakdown below $92.80 will trigger a selloff in stocks.