Market Brief - January, 21 2024
Setting the stage for a brutal February?
Welcome to The Predictive Investor Market Brief for January 21st, 2024!
Last week we did not expect the SPX to hit a new all time high, but we certainly won’t complain about it! We used the strength to take some profits, sell some underperformers, and enter new positions.
Even after the rally on Thurs/Fri, the Russell 2000 is down 4% from its December high. So we did get the pullback we anticipated, just not in the way we expected.
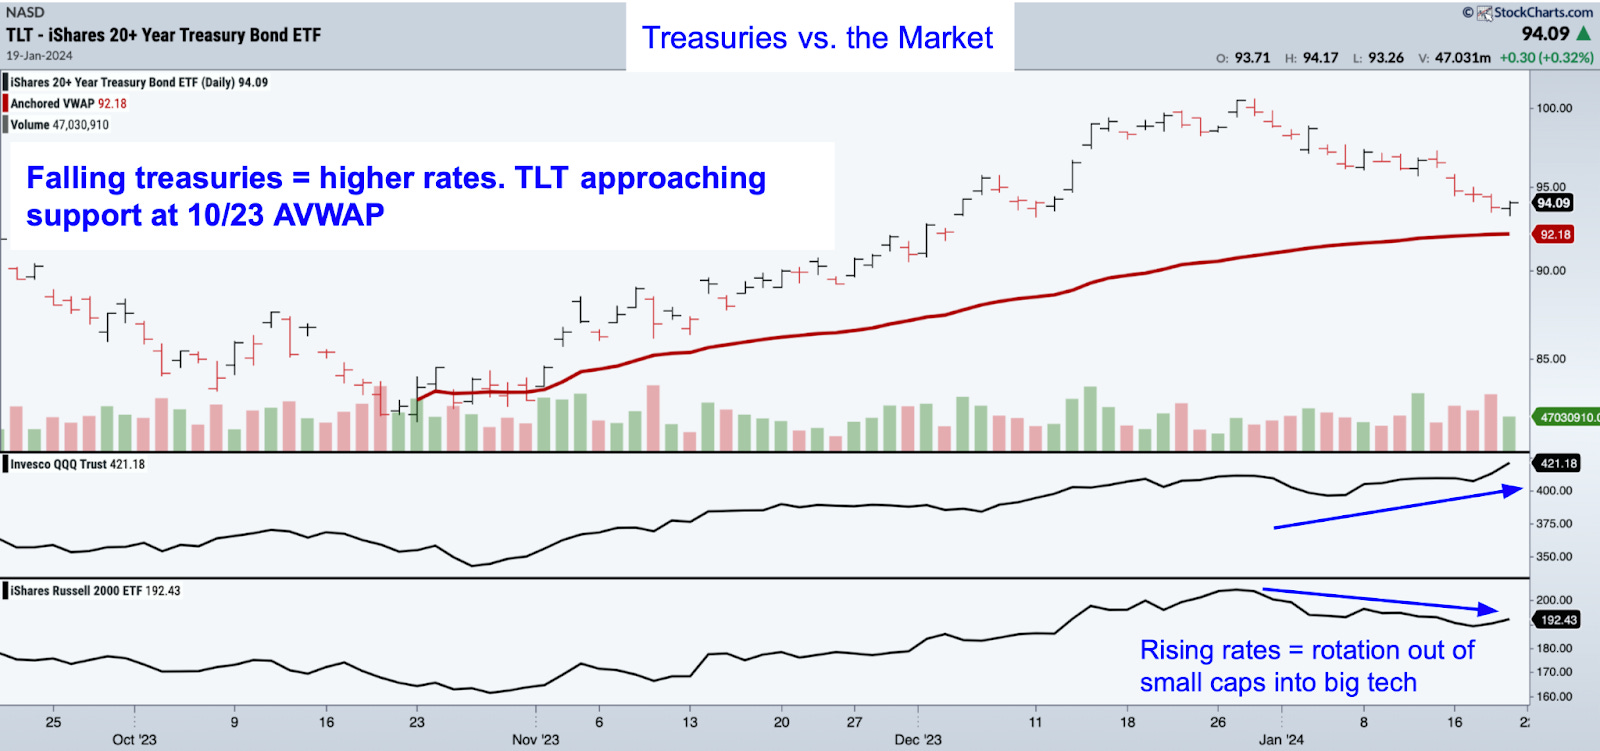
With solid economic news, interest rates are up and the market now places the probability of a rate cut in March at 54% (vs. 73% two weeks ago). The market is pricing this all in, which means a rotation into big tech at the expense of rate-sensitive sectors like utilities and small caps.
While a new closing high for the S&P 500 is bullish near term, February is historically a weak month for big tech. If the rest of the market doesn’t catch up, we could be in for some volatility over the next 4-6 weeks.
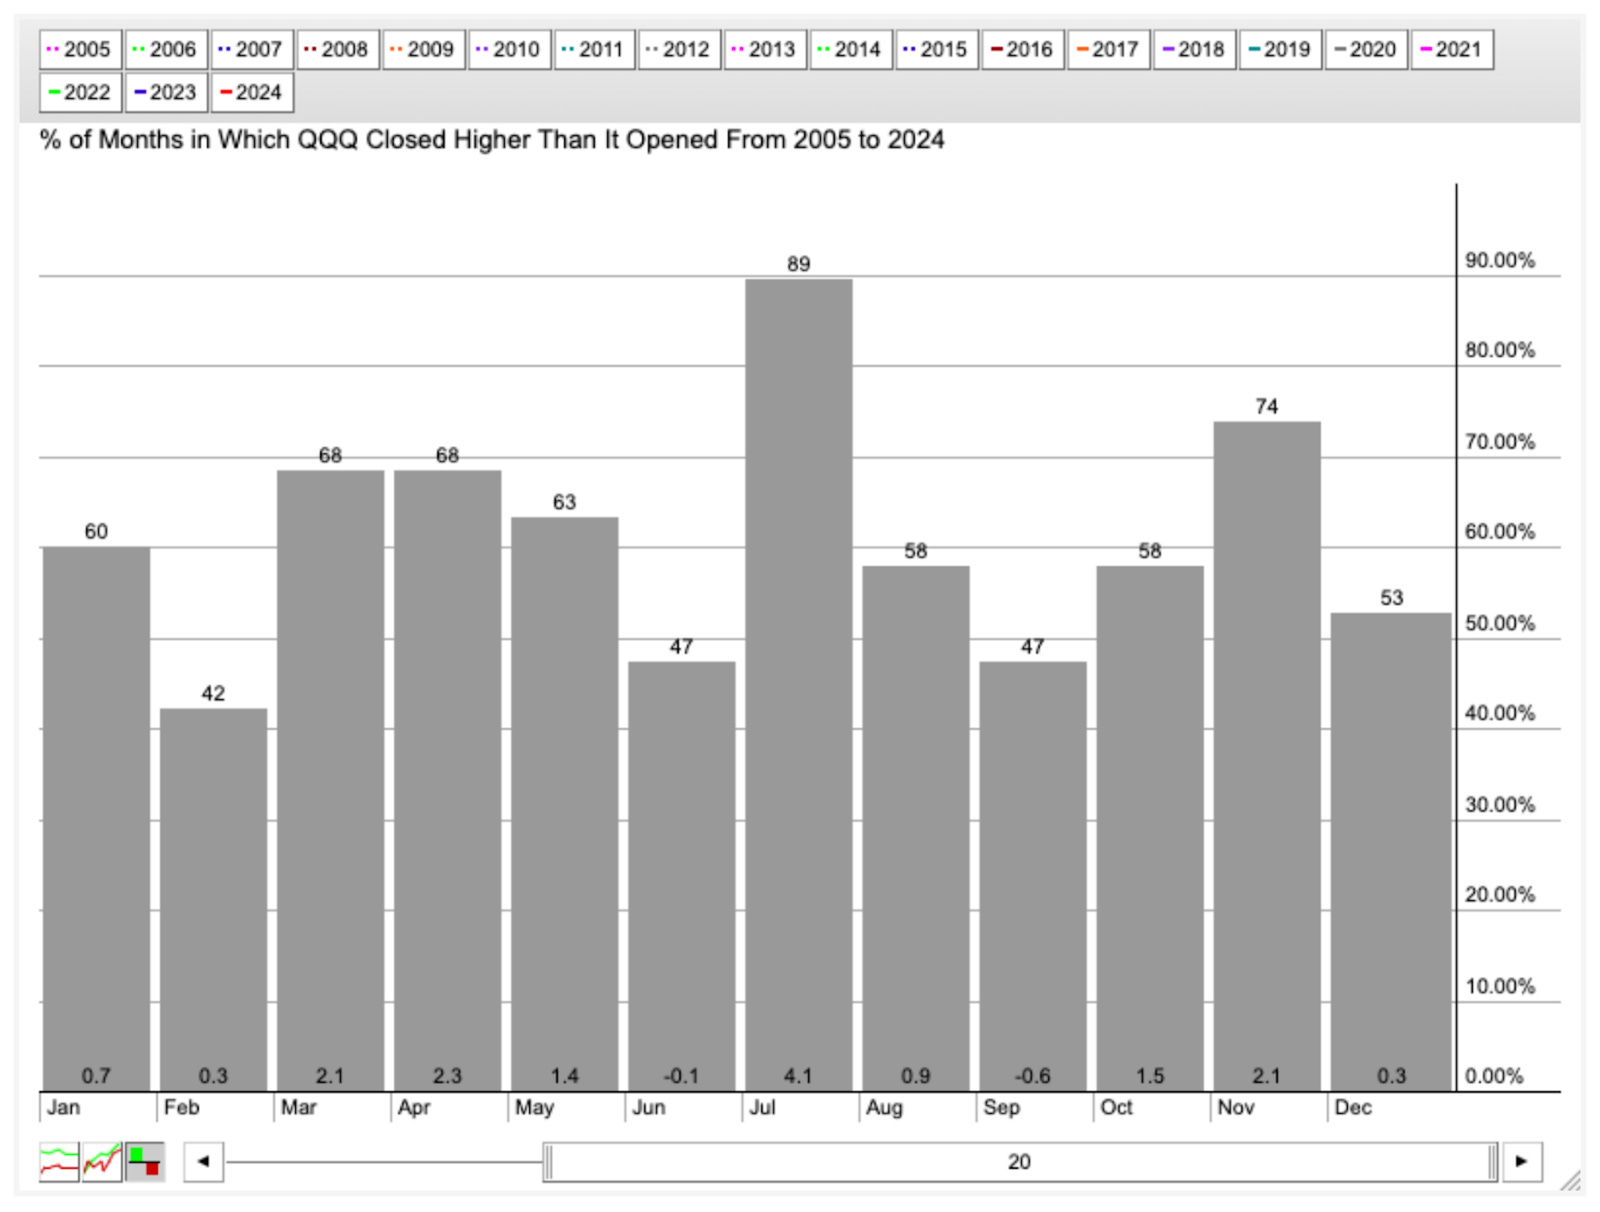
February is a historically terrible month for big tech
Weekend Reads
How does the Fed control interest rates? (Kevin Drum)
“The Fed no longer relies on open market operations to influence interest rates. Instead, it just changes the rate it pays banks on their reserves. If, say, the Fed is paying 5.25%, then short-term bank rates will automatically increase to 5.25%. After all, if a bank can get that much just by letting its money sit safely at the Fed, why would it ever loan out money for less?”
The Bill Is Coming Due on a Record Amount of Commercial Real Estate Debt (WSJ)
“Financial regulators are concerned that commercial-property losses could spill over into the broader financial system. “Sales of financially distressed properties can…lead to a broader downward valuation spiral and even reduce municipalities’ property tax revenues,” according to the Financial Stability Oversight Council, a federal government organization created after the 2008-09 financial crisis to monitor risks to the financial system.”
The Curious Stock Market Pattern in Presidential Election Years (Barron's)
“You should never bet on a seasonal pattern, no matter how strong its statistical basis, unless there is a good theoretical reason for why it should exist in the first place. One possible explanation for this presidential election year pattern is that the stock market performs poorly early in such years in reaction to the economic uncertainty created by the competing candidates’ policies. The market recovers later in such years as this uncertainty reduces, either on Election Day or earlier, if a clear front-runner has emerged.”
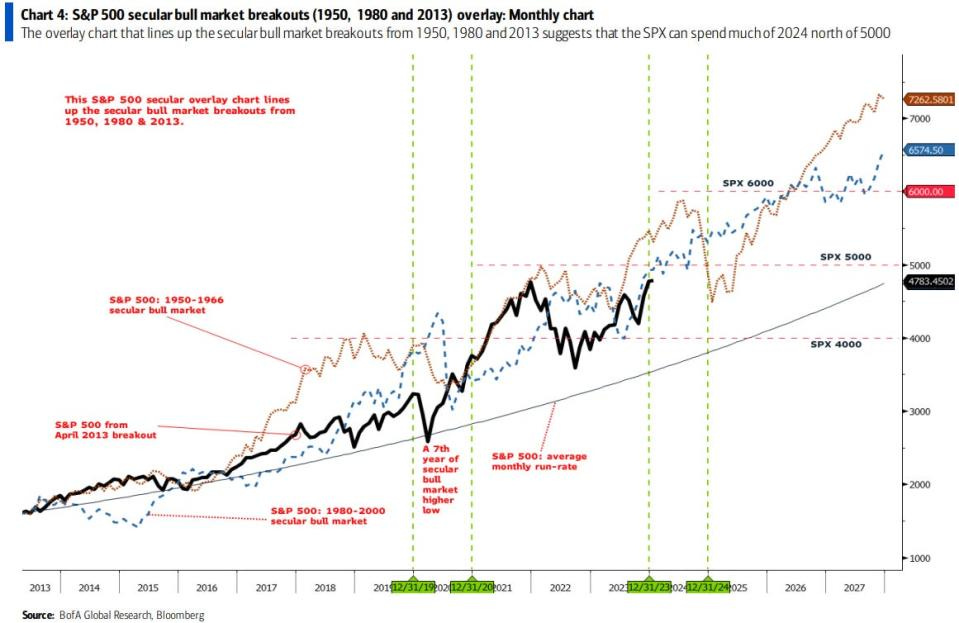
A secular bull market roadmap suggests the current stock rally could last through 2033, Bank of America says (Yahoo Finance)
Market Technical Analysis
Last week we cited RSI divergence as a reason for further consolidation. But in this news-driven market, rising rates provided just enough of a jolt to big tech to get the S&P 500 to a new closing high. We’ll be watching how TLT trades near the 10/23 AVWAP. A rally off this support line should give small caps a boost.
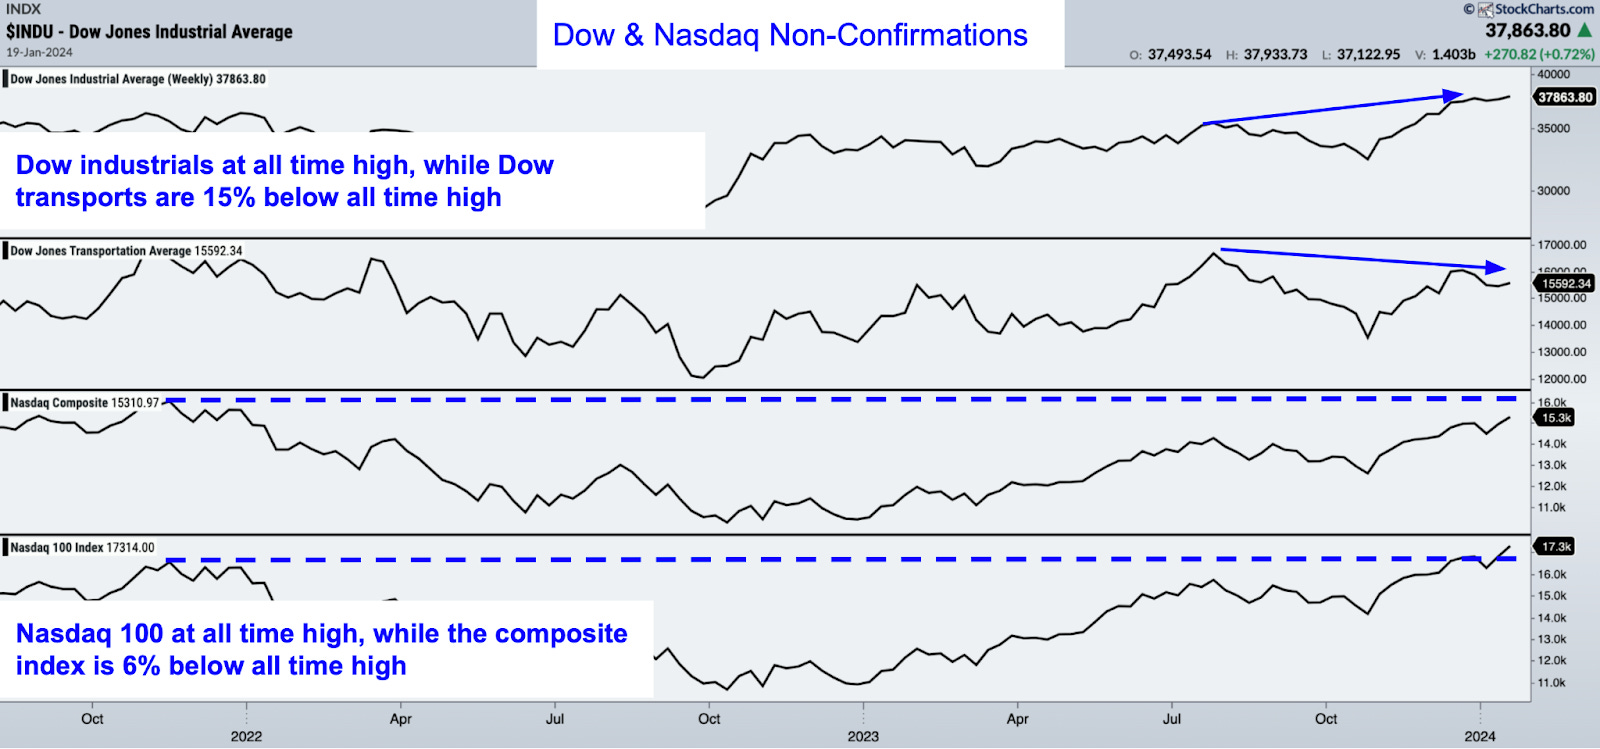
Dow Theory Non-Confirmation
The Dow industrials has continued its push to new all time highs, but the transports are still 15% below its all time high set in November 2021. It is easy to dismiss this given how the market has mostly been driven by rates and inflation. But the Dow Theory remains the oldest and one of the most reliable technical indicators. According to Dow Theory, a bull market doesn't begin until the the transports confirm the industrials rally with a new high.
The Nasdaq 100 is also outpacing the Nasdaq Composite index. Given the weak seasonality in February for QQQ, we would remain cautious trading mega cap tech.