
Market Brief - July 23, 2023
Welcome to The Predictive Investor Market Brief for July 23rd, 2023!
The Dow finally had a winning week - up 2.1% vs. 0.7% for the S&P 500, 1.5% for the Russell 2000, and -0.6% for the Nasdaq. The divergence between industrials and tech was due to post-earnings gains from UnitedHealth Group, Johnson & Johnson, IBM and Travelers.
So far Q2 earnings are off to a solid start: 5.1% year-over-year growth vs. the estimated -6.8% decline. But this week brings a significant number of announcements with 850 U.S. companies set to release results, including Alphabet, Meta and Microsoft. Combine that with a potential rate hike on Wednesday, and we could see a significant amount of volatility this week.
Media Focus: Important stories (and what they mean)
Did FAANG Break the Nasdaq 100?
Before the market opens tomorrow morning, the Nasdaq 100 will undergo a special rebalance to reduce the overconcentration of mega cap tech. Currently, 5 stocks (Apple, Microsoft, Nvidia, Alphabet and Amazon) make up nearly 47% of the 100-stock index. The rebalance could bring this down to 38.5%.
Our take: While this may cause some volatility over the short term, there will be little long term impact. Overconcentration in an index is nothing new. Earnings will determine where these stocks go from here. This has a bigger impact on portfolio managers who benchmark to this index, as it will likely lower 2023 performance, making it ever so slightly easier for them to outperform.
Barron’s: The Inflation Giant Has Awakened. Why Price Growth Will Persist
The story compares the current environment to the 1970s, where inflation jumped around quite a bit and stayed elevated for much longer than anyone thought possible at the time. The rationale cited here is that a tight labor market will continue putting upward pressure on wages, and climate change will continue to disrupt food supply. The author implies that there will be political pressure on the Fed to lower rates too soon.
Our take: Everyone knows that despite the declining CPI, consumers continue to get squeezed by rising prices. Just ask anyone who’s paid for college, gone to the doctor and sought child care - all services that have risen significantly more than the average 3% per year. And that is unlikely to change, even if the official CPI comes down to the Fed’s 2% target. But one big inflation factor is missing from the above analysis: housing.
Housing makes up over 43% of the CPI, and the calculation includes rent and Owners Equivalent Rent, which is an estimate of what homeowners would have to pay to rent a similar house. Currently, the shelter component of CPI is up about 8% year-over-year.
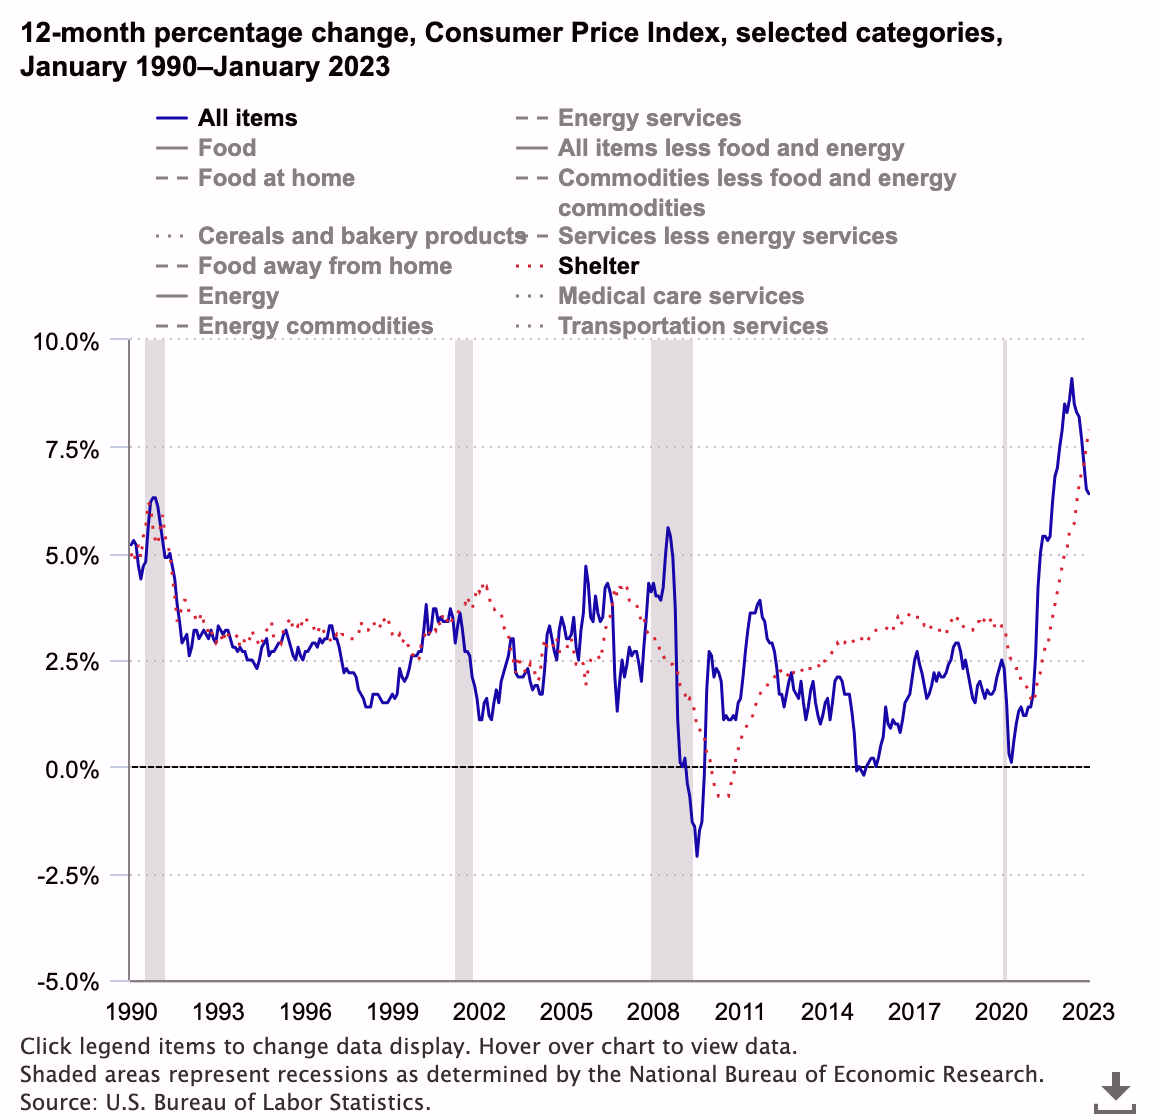
But according to Rent.com, the median monthly rent in the country increased just 0.5% year-over-year. Why the disconnect? The CPI shelter data is calculated every 6 months, so it’s over-indexing on older housing prices, which keeps the CPI higher for longer.
The biggest risk with regard to inflation and the economy over the intermediate term (this newsletter’s time horizon) is that the Fed hikes too many times, or keeps rates higher for longer in the name of getting the CPI down to 2%. This is why Wall Street hangs onto every word at these Fed meetings. Wednesday will be fun.
Societe Generale: Recession Delayed
A top strategist at the French investment bank argued that the “imminent recession” that economists predicted has been delayed due to impeccable timing by the corporate sector.
Typically when rates increase, so do corporate interest payments. But it turns out interest expenses are at the lowest level in decades (see chart below), as companies took advantage of record low rates to refinance liabilities into long term fixed-rate debt. This means companies did not have to resort to as many layoffs as analysts predicted.
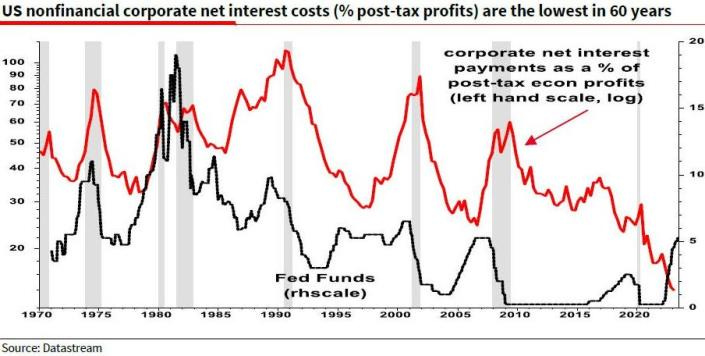
Our take: Debt can certainly sustain growth for a period of time, but eventually the bills come due. Most of this debt matures in the late 2020s, and it’s unlikely rates will be back near zero any time soon. This will provide a headwind for growth later this decade.
The ultimate contrarian call here is that the recession already happened. Recessions are often defined as two consecutive quarters of declining GDP, and the first two quarters of 2022 fit the bill. This view aligns with the decennial cycle for stocks, where the typical decade gives us two bear markets: one early in the decade (typically between years 0-3) and one later in the decade (typically between years 6-8).
Carvana earnings beat - soars 38% on Wednesday
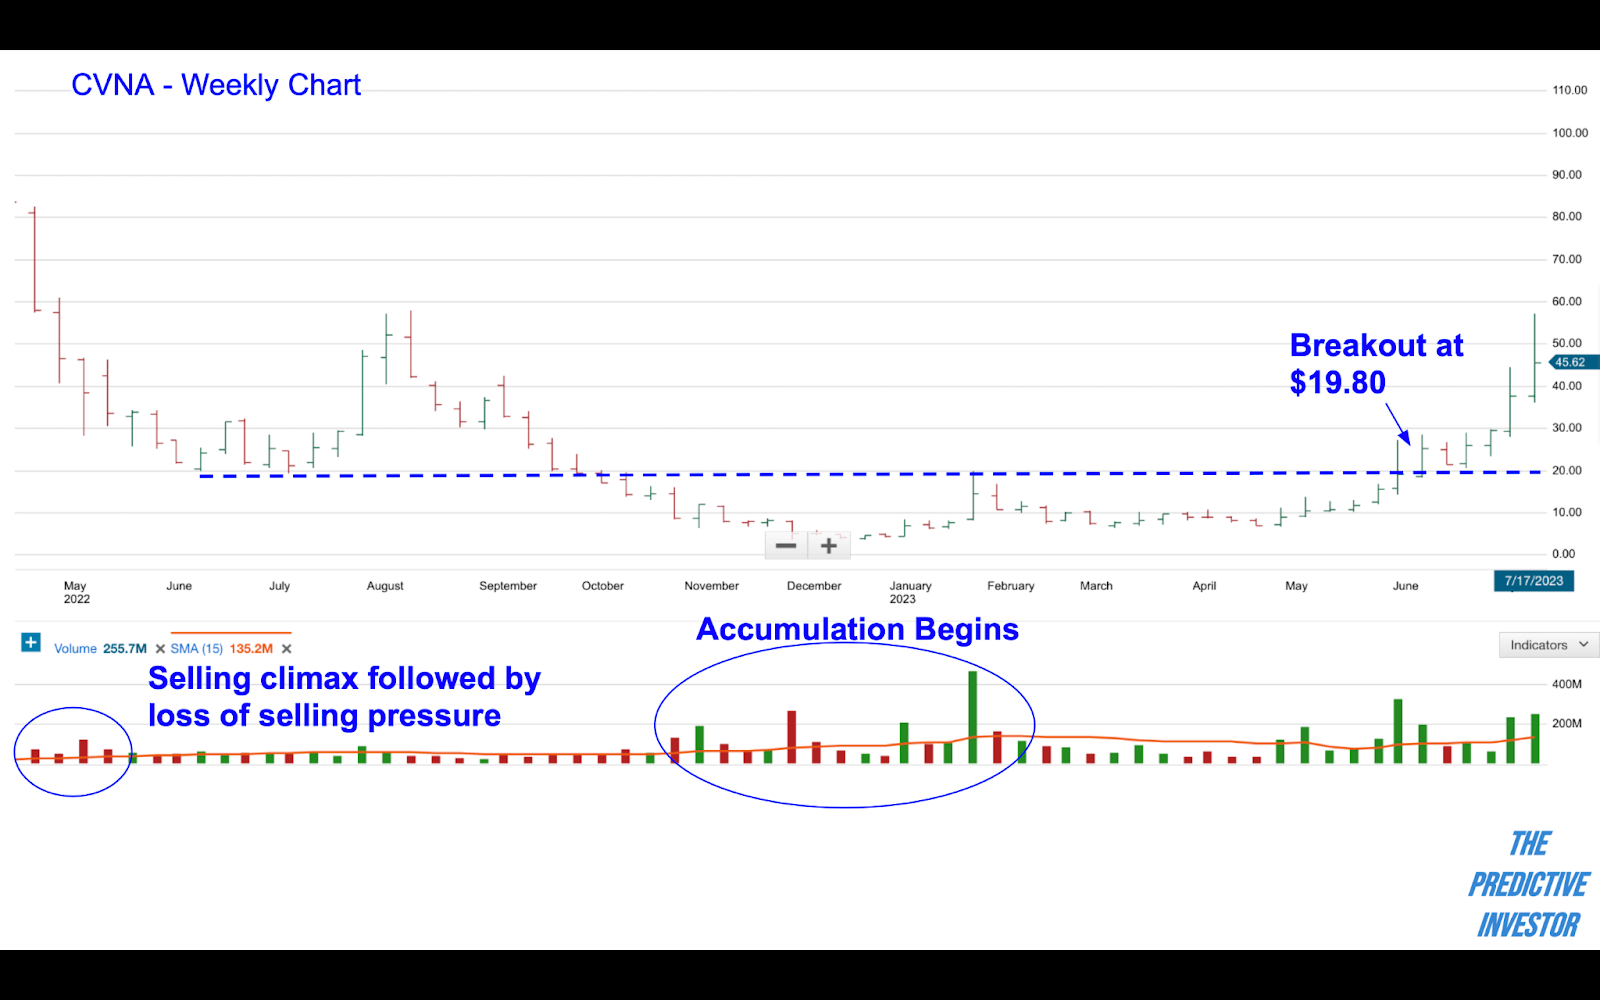
CVNA reported earnings of ($0.55), beating analyst estimates of ($1.20) per share. The company also restructured some of its debt, which will reduce interest expenses by more than $430 million per year over the next two years.
Meanwhile, analyst sentiment on the stock has been extremely negative. JP Morgan downgraded the stock just a week ago, and Piper Sandler and RBC Capital both downgraded the stock after last week’s earnings announcement.
Our take: This is a classic case of Wall Street using bad news to generate sell orders so they can accumulate a stock. Looking at the chart below, you can see there was significant accumulation followed by a breakout several weeks before this good news. Just another example of why we track sentiment and assess supply/demand before adding a stock to the portfolio.
Market Technical Analysis
Russell 2000 (IWM)
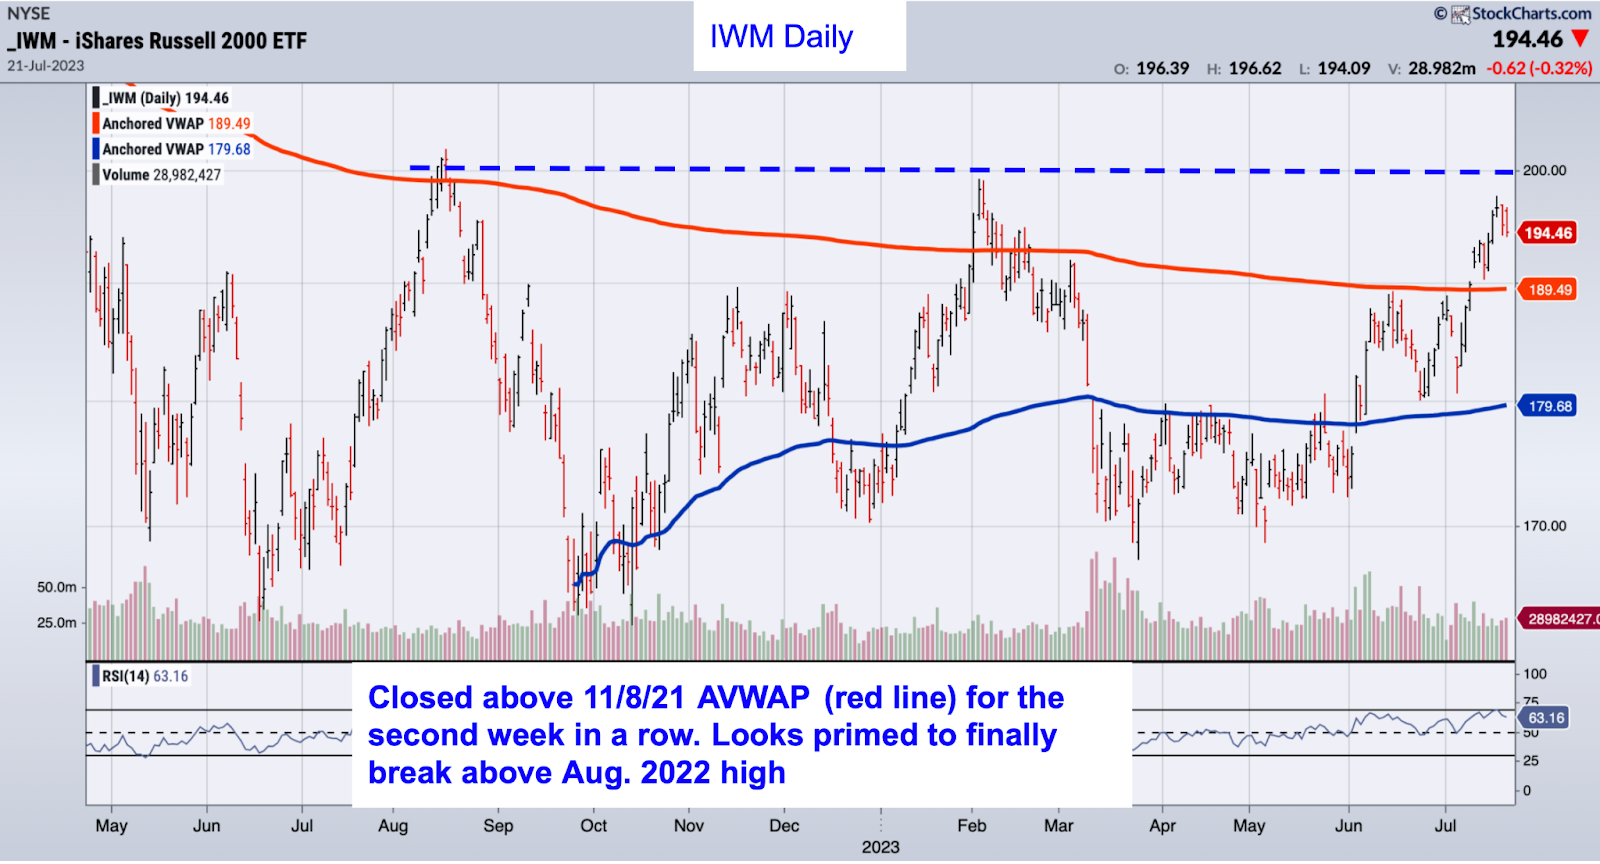
IWM closed the week above the 11/8/21 AVWAP for the second week in a row, and looks primed to take out the August 2022 closing high of $200. We will add some stocks to the portfolio next week if we get a pullback.
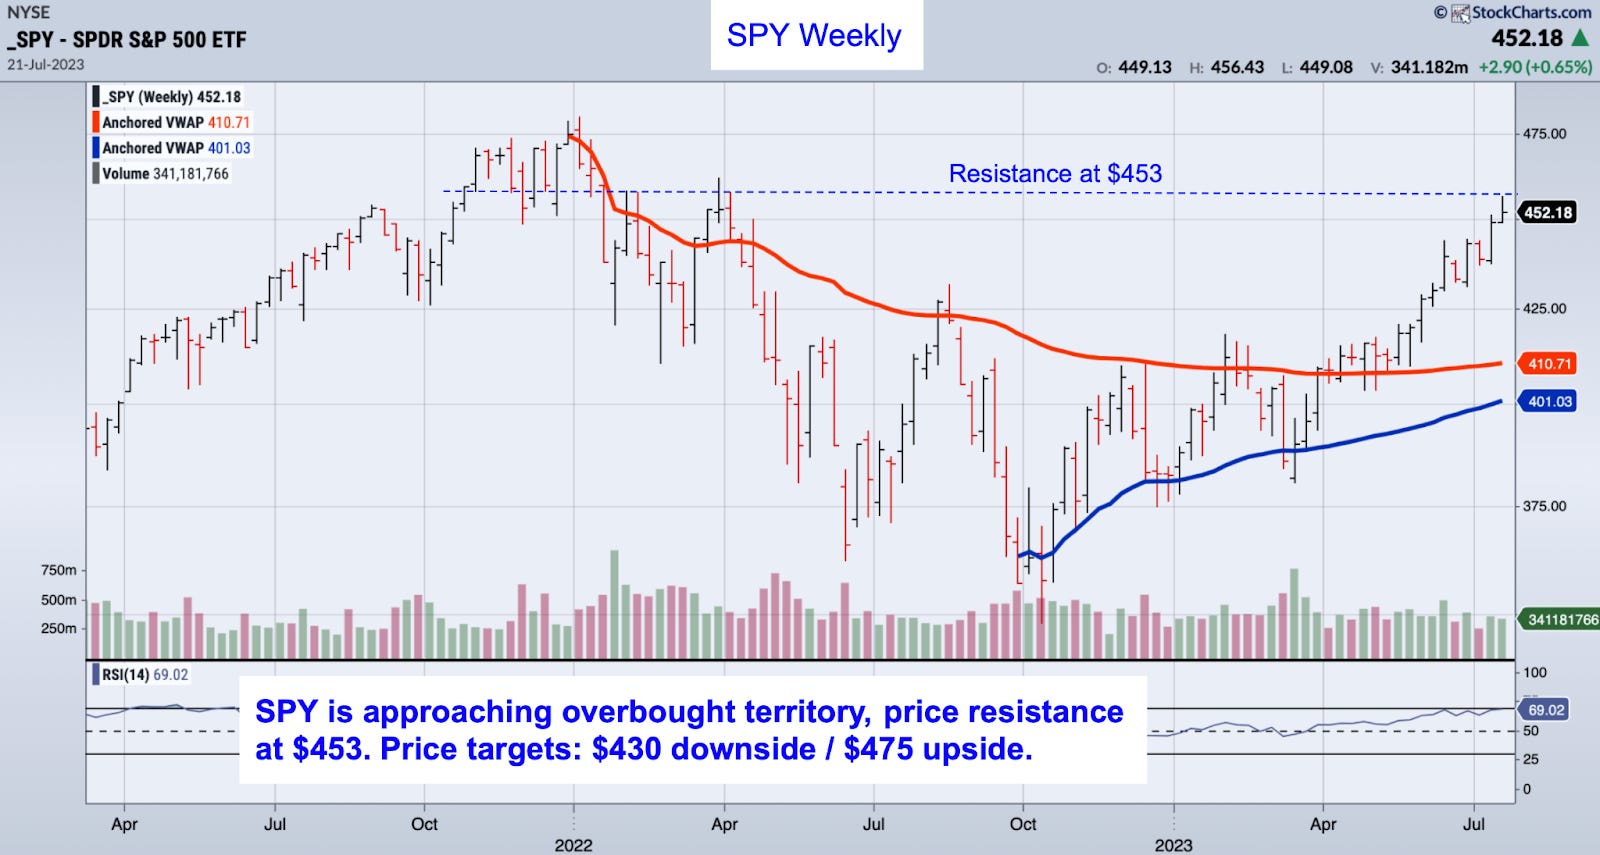
S&P 500 (SPY)
No change to our forecast for SPY, as earnings could totally overtake any technical analysis. If we get a correction, we’ll be looking for a pullback to at least $430. A break of $453 resistance on good earnings news will take us to $475.
Market Sentiment
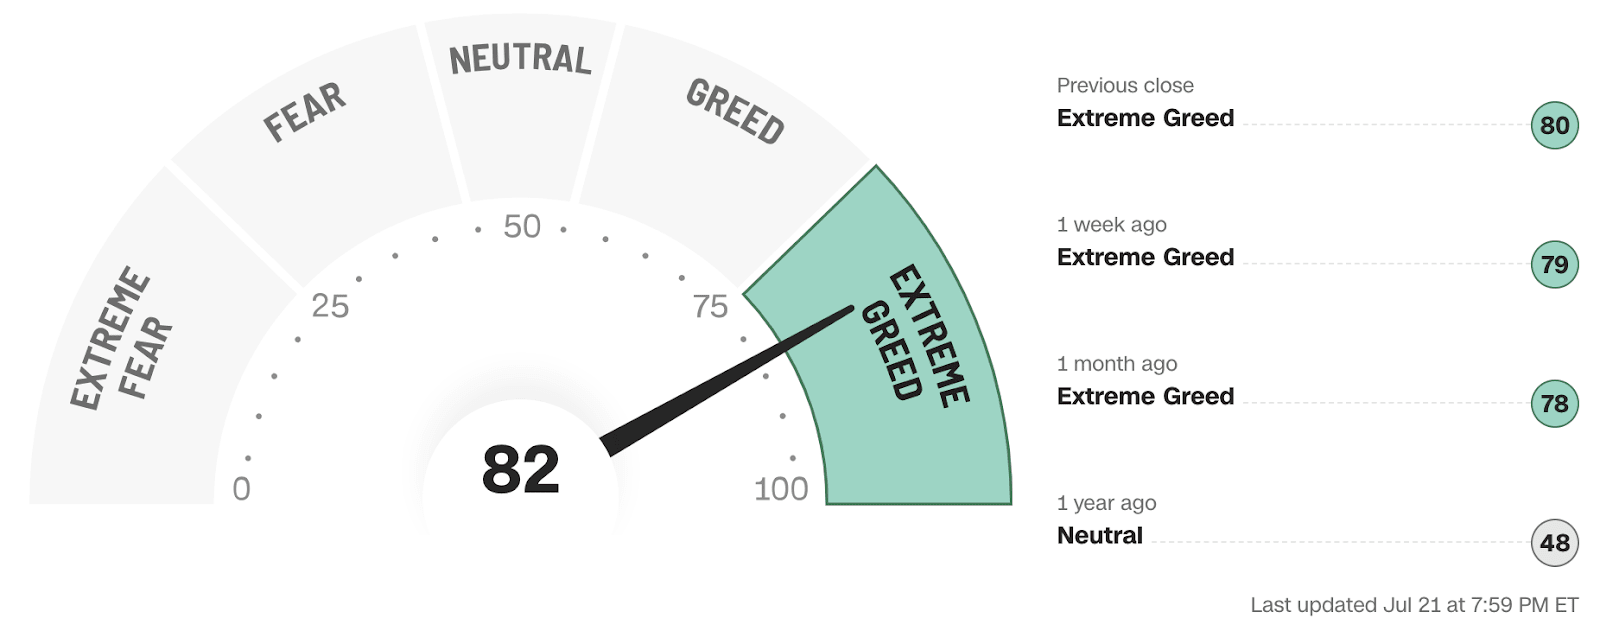
The CNN Fear & Greed Index closed the week at 82, keeping the index in extreme greed territory since June 27th. Readings above 80 tend to coincide with market corrections.
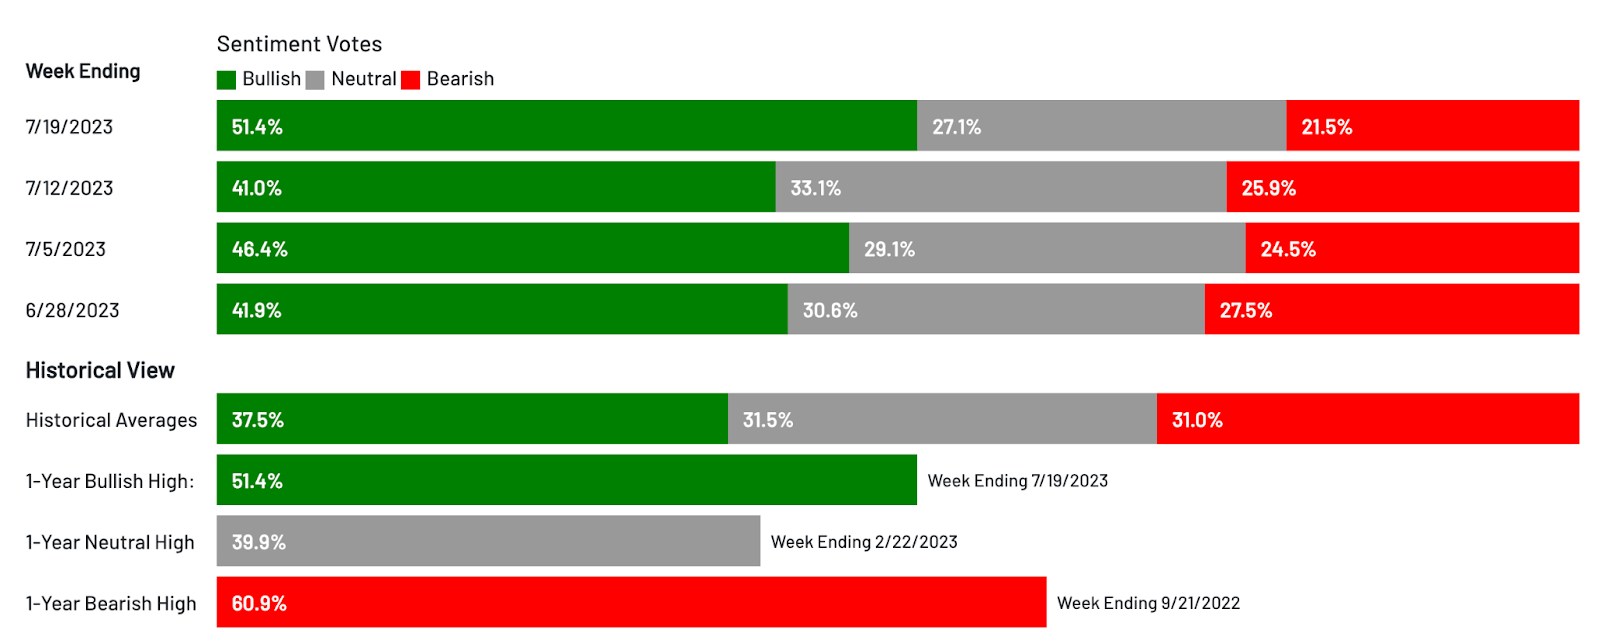
AAII Investor Sentiment Survey
Huge jump in bullish sentiment! Last week we indicated we’d be looking for a short-term top when more than half of investors surveyed are bullish. We did not expect that to happen so soon! We are now starting to see sentiment extremes typically associated with market corrections.
The bottom line: Sentiment indicators are getting heated and hundreds of companies are set to release Q2 earnings results over the next several days, giving us the potential for a very volatile week. We will continue to add positions to the portfolio on any pullback, but would prefer a solid correction to buy more aggressively.