
Market Brief - July 9, 2023
Stocks pulled back modestly during the short week due to continued strength in the labor market, which increases the likelihood the Fed will raise rates later this month.
The Labor Department reported a 209,000 increase in nonfarm payrolls in June, which was below the expected number of 220,000. While this indicates job creation is slowing, the report also showed average wages are up 4.4% on an annualized basis, providing a headwind in getting inflation down. Additionally, a report from payroll processor ADP showed the economy added 497,000 private sector jobs in June, more than double what was expected.
This all means the Fed will likely continue raising rates, or keep financial conditions tighter for longer, putting downward pressure on stocks.
There are a few market moving events next week:
June’s Consumer Price Index report to be released on Wednesday
June’s Producer Price Index report to be released on Thursday
Several big banks kick off earnings season on Friday: BlackRock, Citigroup, JPMorgan, and Wells Fargo
S&P 500 earnings are expected to decline by -6.8% in Q2. Stocks have rallied on the anticipation of growth resuming in the second half of the year. So forward guidance will be especially critical this earnings season.
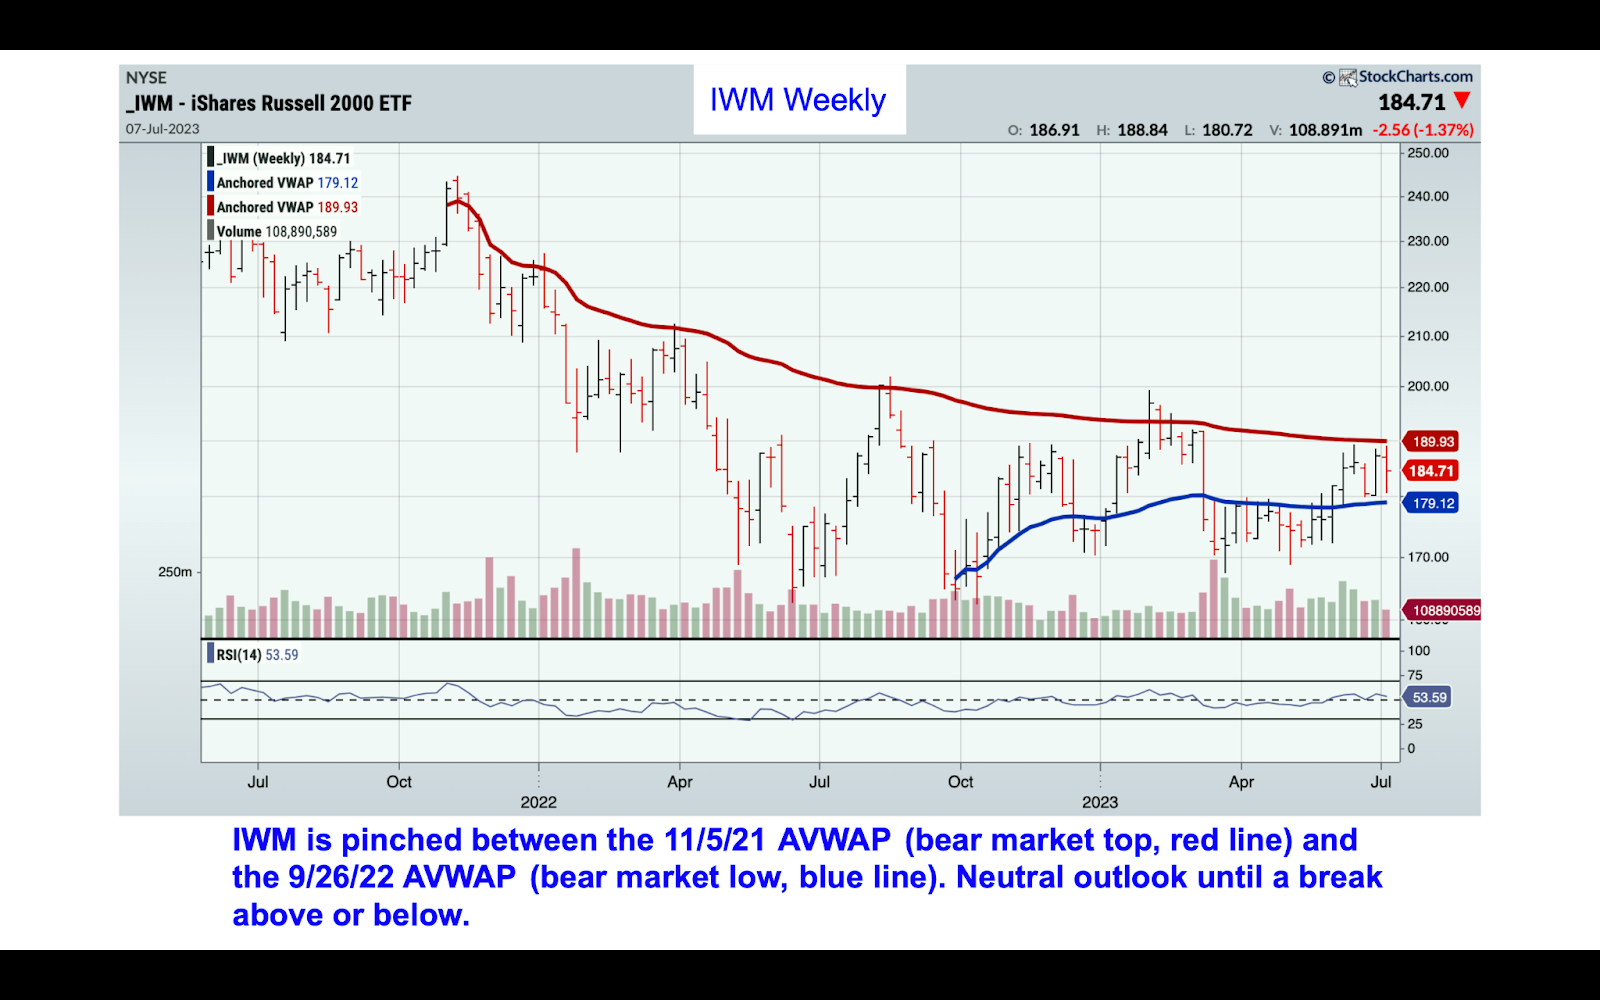
Russell 2000 (IWM)
IWM remains stuck between the cumulative average prices from the bear market top (red line) and bear market low (blue line). Our outlook remains neutral until we get a break above/below either line.
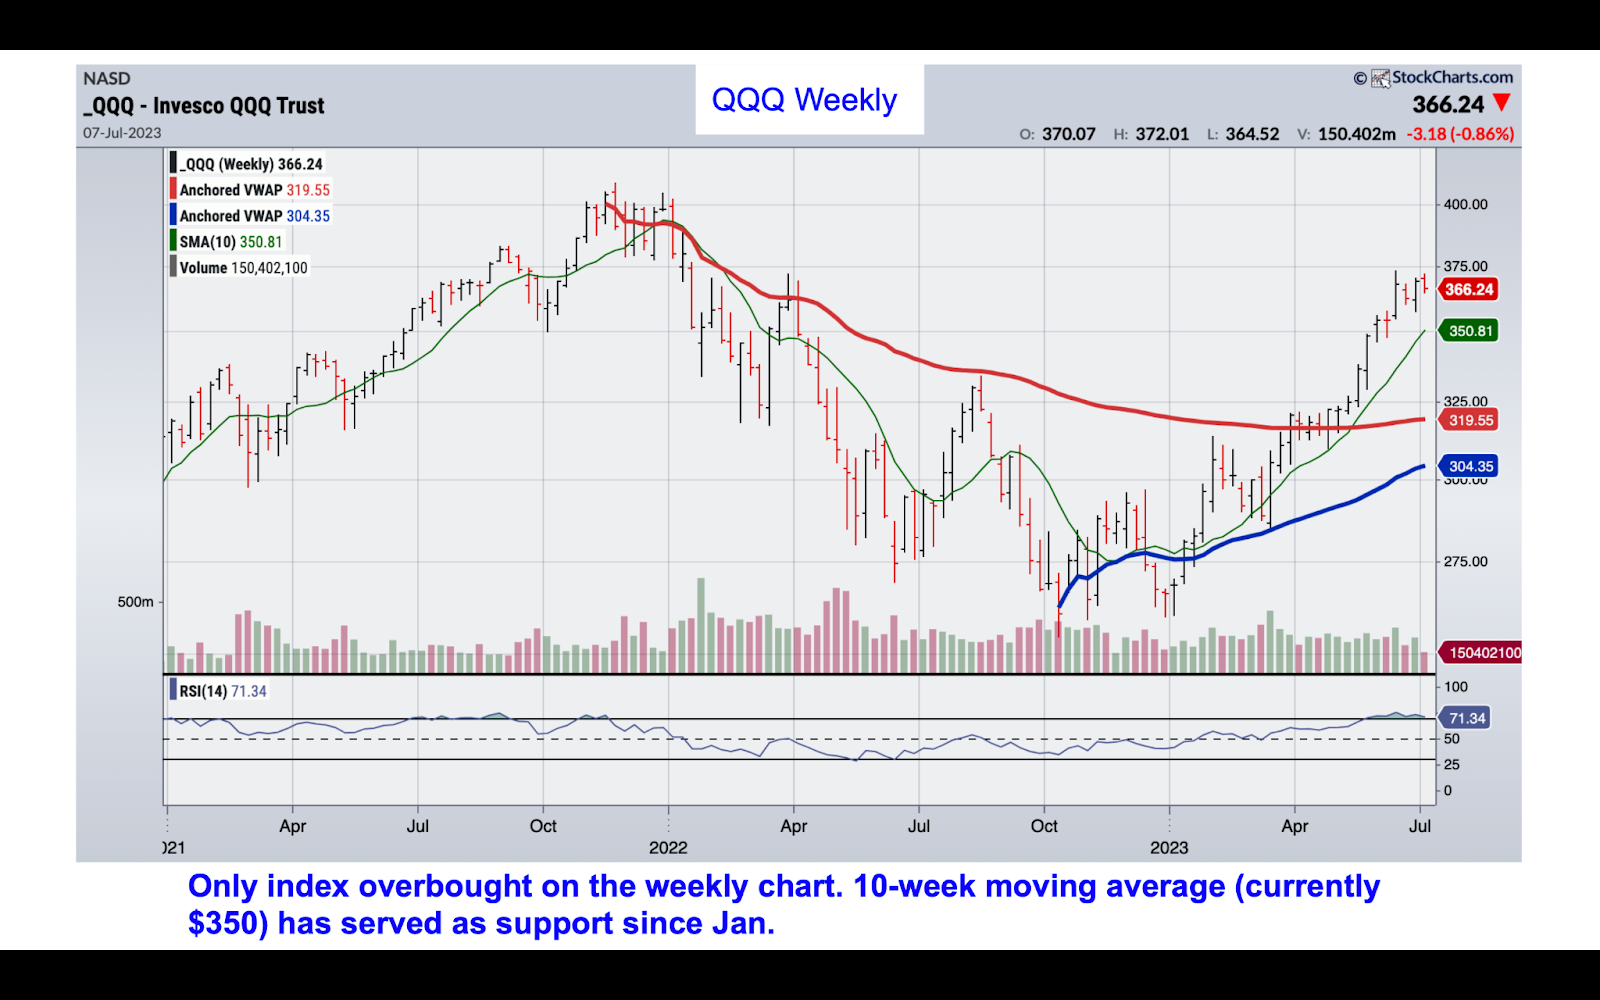
Nasdaq (QQQ)
RSI is overbought on the weekly chart, and trending down on the daily. We would stay away from big tech until we get a pullback. The 10-week moving average (currently at $350) has provided solid support since January.
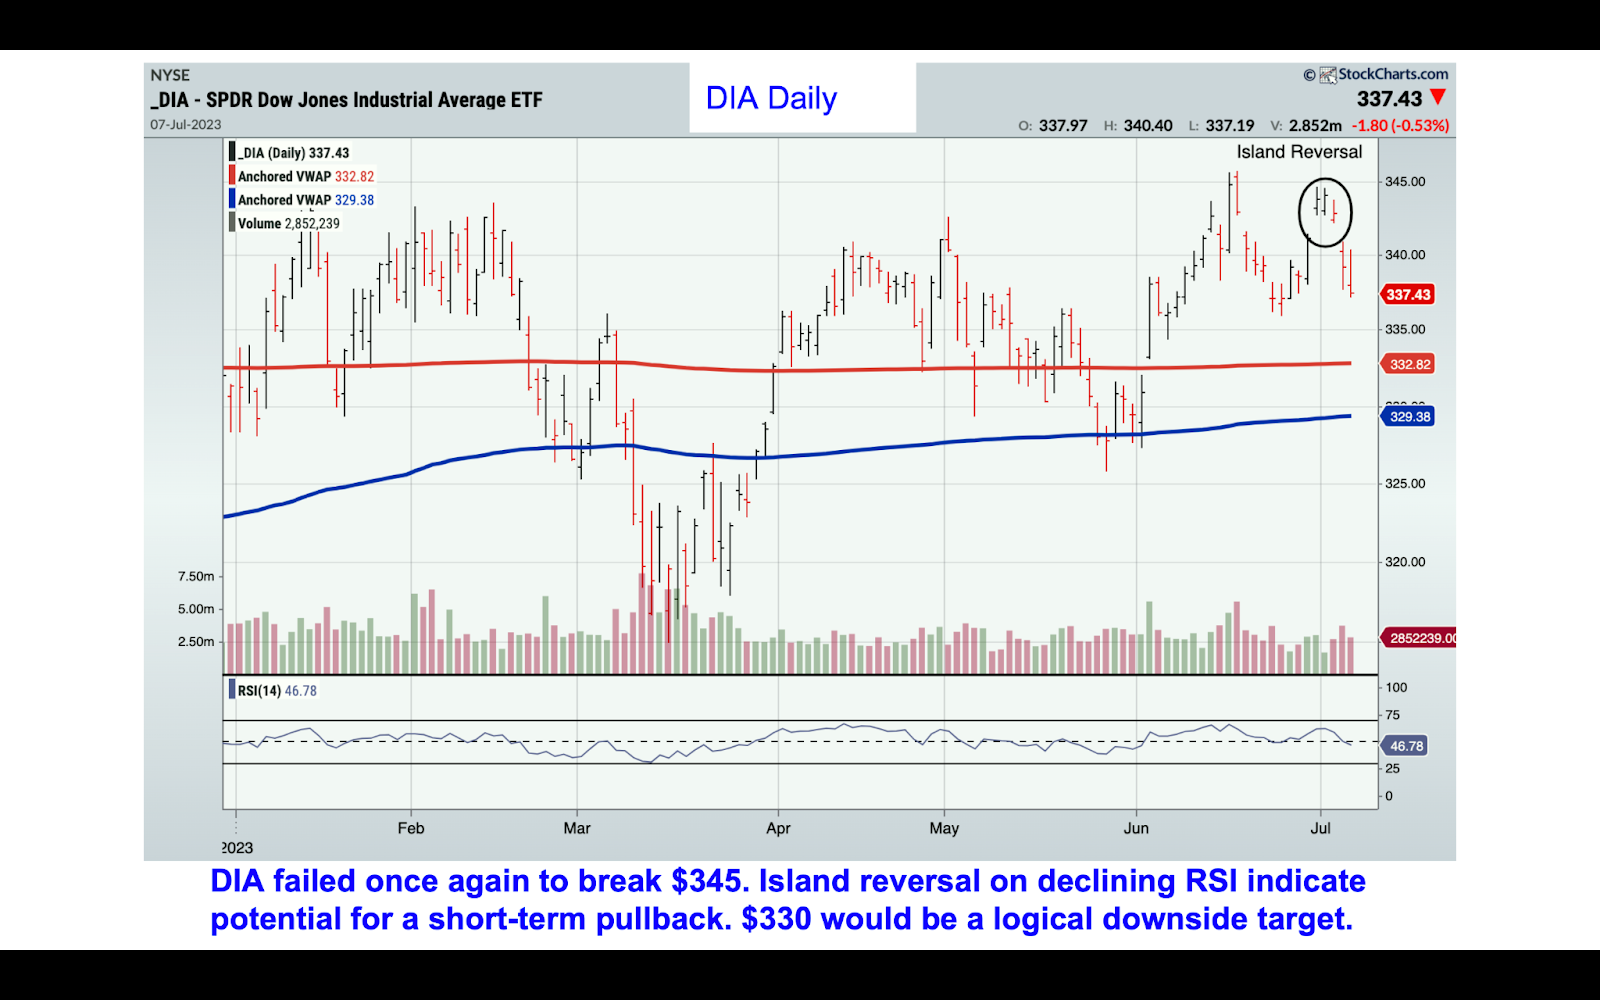
Dow Jones Industrials (DIA)
DIA is the weakest of the market indexes. Last week closed with an island reversal near long term resistance of $345, along with a declining RSI. Flat AVWAP lines from the market top (red line) and the bear market bottom (blue line) indicate very little conviction among both bulls and bears.
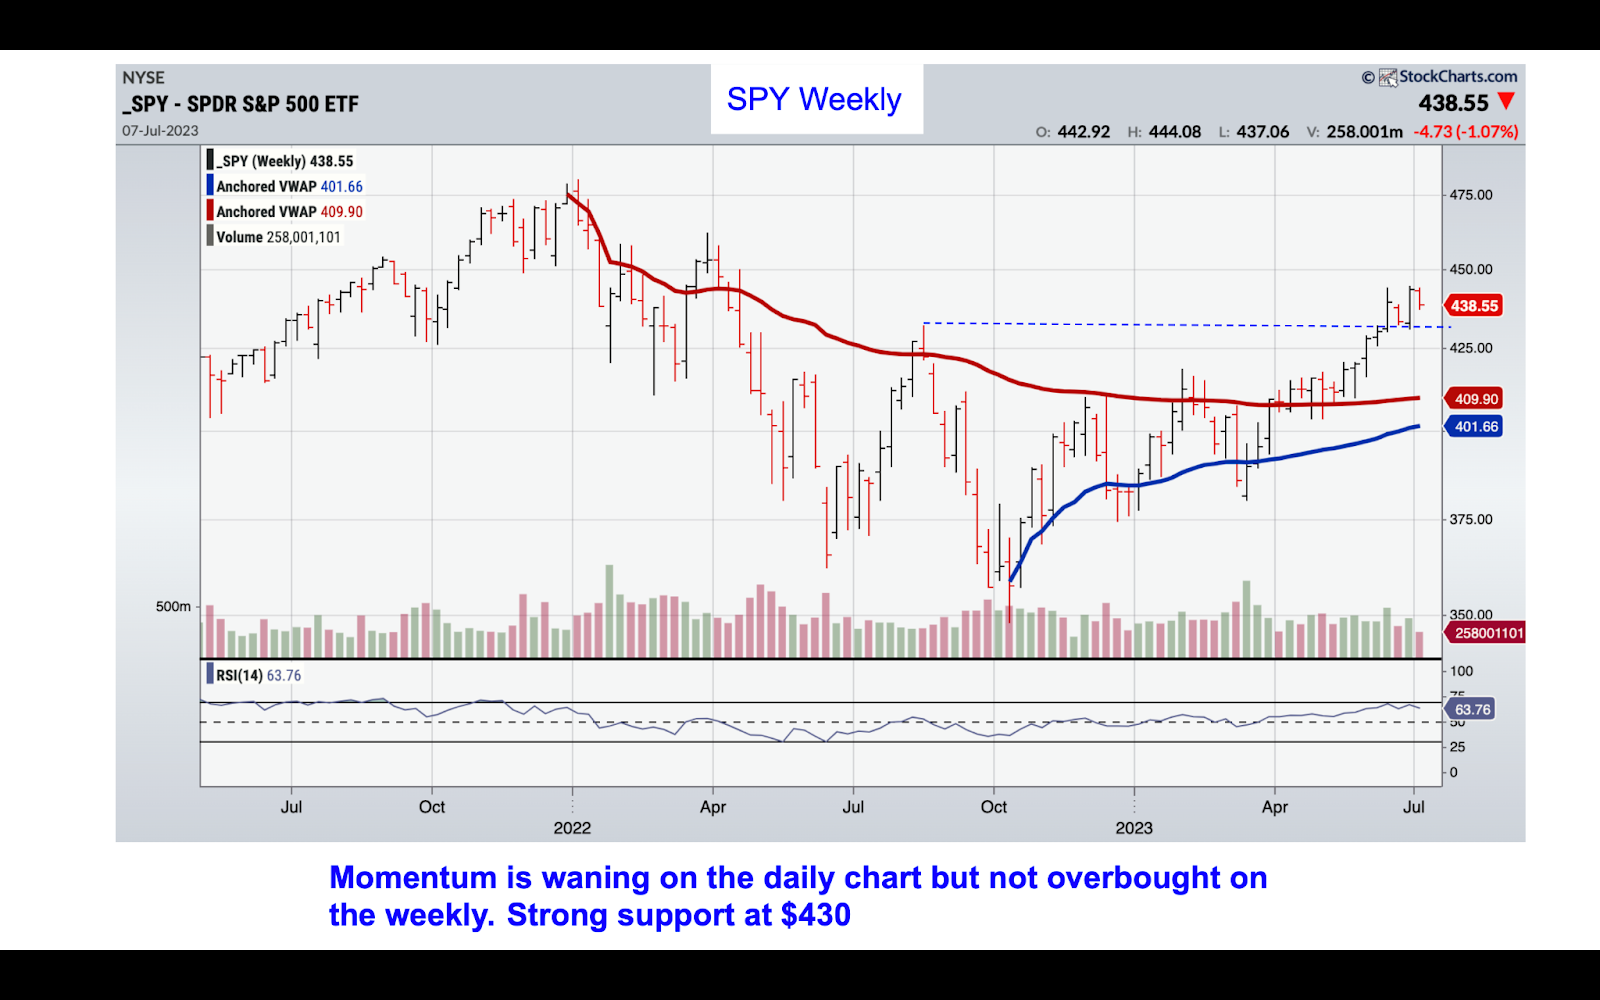
S&P 500 (SPY)
RSI is declining on the daily chart, but relatively flat on the weekly (below). If the market does pull back, $430 offers solid support.
Market Sentiment
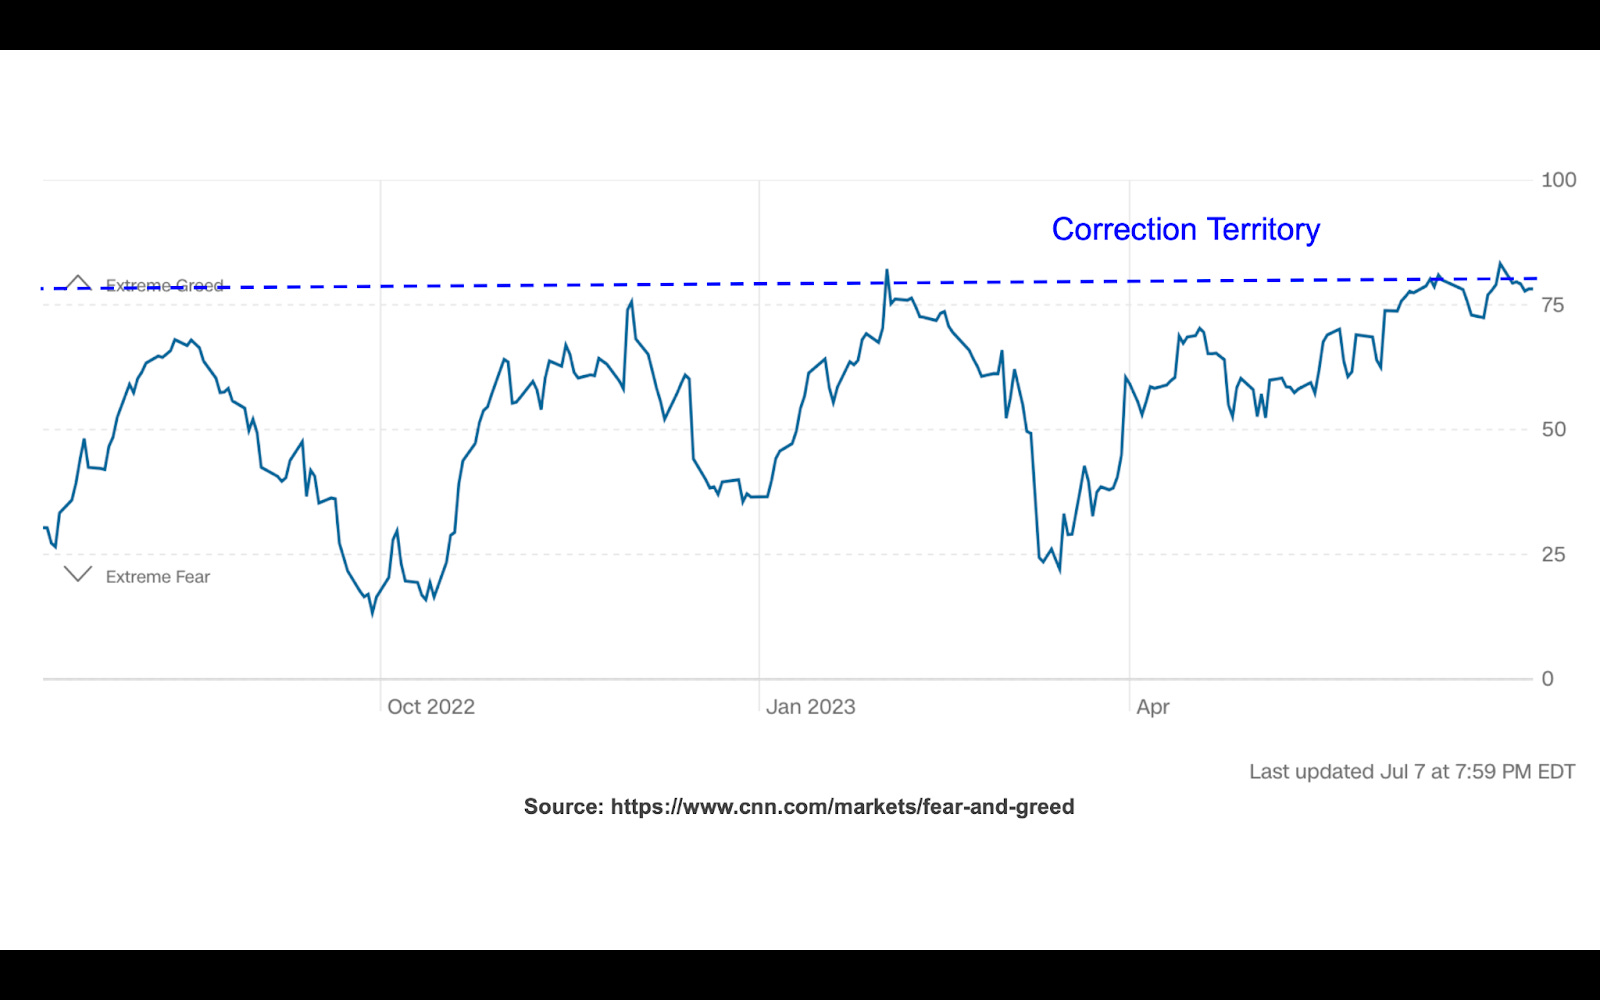
The CNN Fear & Greed Index closed the week at 78, keeping the index in extreme greed territory since June 27th. Readings above 80 tend to coincide with market corrections.
The bottom line:
While the intermediate term outlook remains bullish, momentum is starting to wane over the short term. But technical analysis will take a back seat to the inflation reports and the start of Q2 earnings releases. We will not take any additional trades until we see the market’s reaction to the CPI report, to be released on Wednesday morning.