
Market Brief - June 11, 2023
The major stock indexes were mostly flat last week, with the exception of the Russell 2000, which gained about 2%. Additionally, the S&P 500 Equal Weight ETF (RSP) gained about 1%, indicating that this rally is starting to broaden.
There are two primary drivers behind recent stock market performance:
The market is repricing companies into AI winners and AI losers, which has resulted in tech outperforming the other equity classes YTD.
The market is pricing in a soft landing for the economy, mostly based on the resilience of the labor market.
While we’re especially skeptical of the U.S. avoiding a recession, we have to respect price action, and as of now the path of least resistance is up.
Breakout or Fakeout?
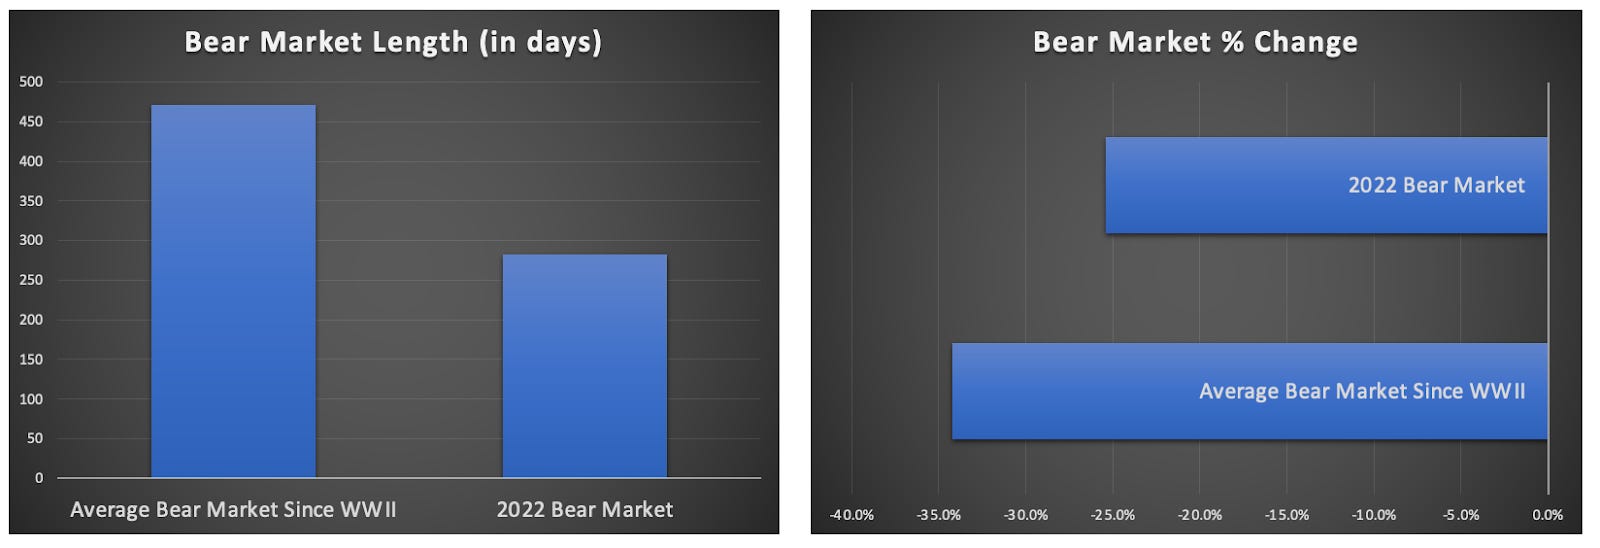
On Thursday, the S&P 500 closed 20% above its October 12th low, meeting the technical definition of a bull market. This took many analysts by surprise, party because compared to the average bear market since WWII, the 2022 bear market was both shorter and had less drawdown.
From a macro perspective, most leading economic indicators (housing permits, retail sales, profit margins, yield curve, etc.) are still indicating a high likelihood of a recession sometime this year.
Our strategy doesn’t really require us to make a definitive call one way or the other. Since we invest over the intermediate term, we buy on signs of accumulation and sell on signs of distribution. And right now, the bulls appear to be taking control of this market.
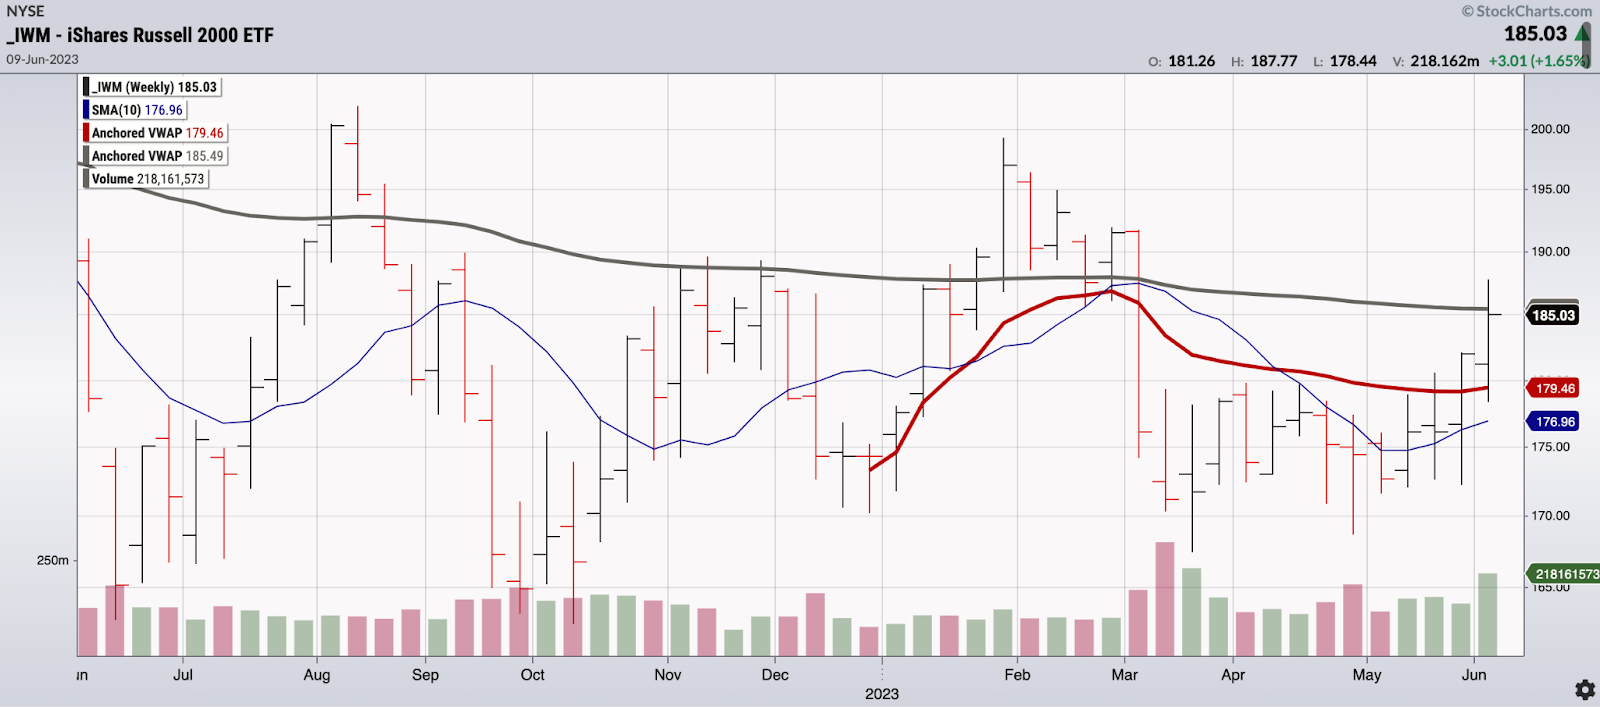
Russell 2000 (IWM)
The chart below shows 3 indicators overlaying IWM. The gray is the cumulative average price since the index topped in November 2021 (AVWAP). The red line shows the cumulative average price YTD, and the purple is the 10-week moving average.
IWM closed at the AVWAP from the time the bear market started, which has been a point of resistance in the past. We typically like to see the 10-week moving average above the YTD AVWAP in order to be bullish on an index. Both are trending up, so we’re almost there.
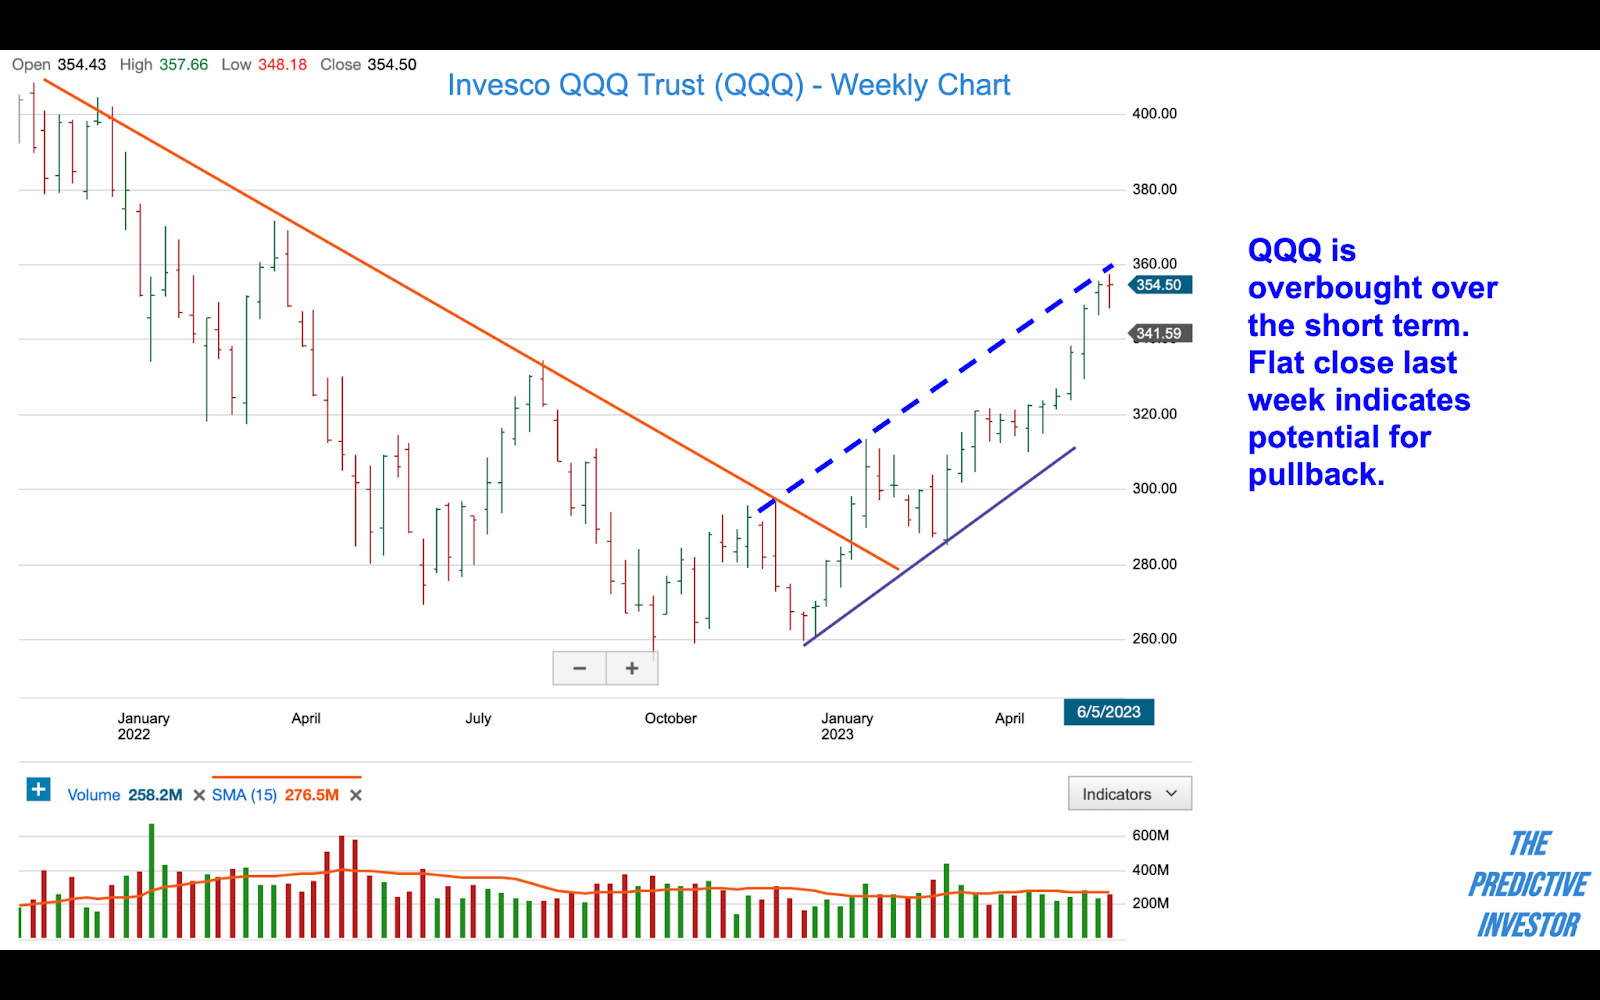
Nasdaq (QQQ)
Tech has been on a tear with the Nasdaq up 26.7% year to date. The index is overbought over the short term and near the top of a trend channel that has contained all price action since the start of the year. It would be healthy to see a minor correction over the next few weeks.
Dow Jones Industrials (DIA)
DIA continues to struggle and the chart remains mostly unchanged from last week. A number of Dow stocks are oversold, so positive inflation/Fed news this week could be the catalyst for DIA to join the rest of the market and break out of resistance at $345.
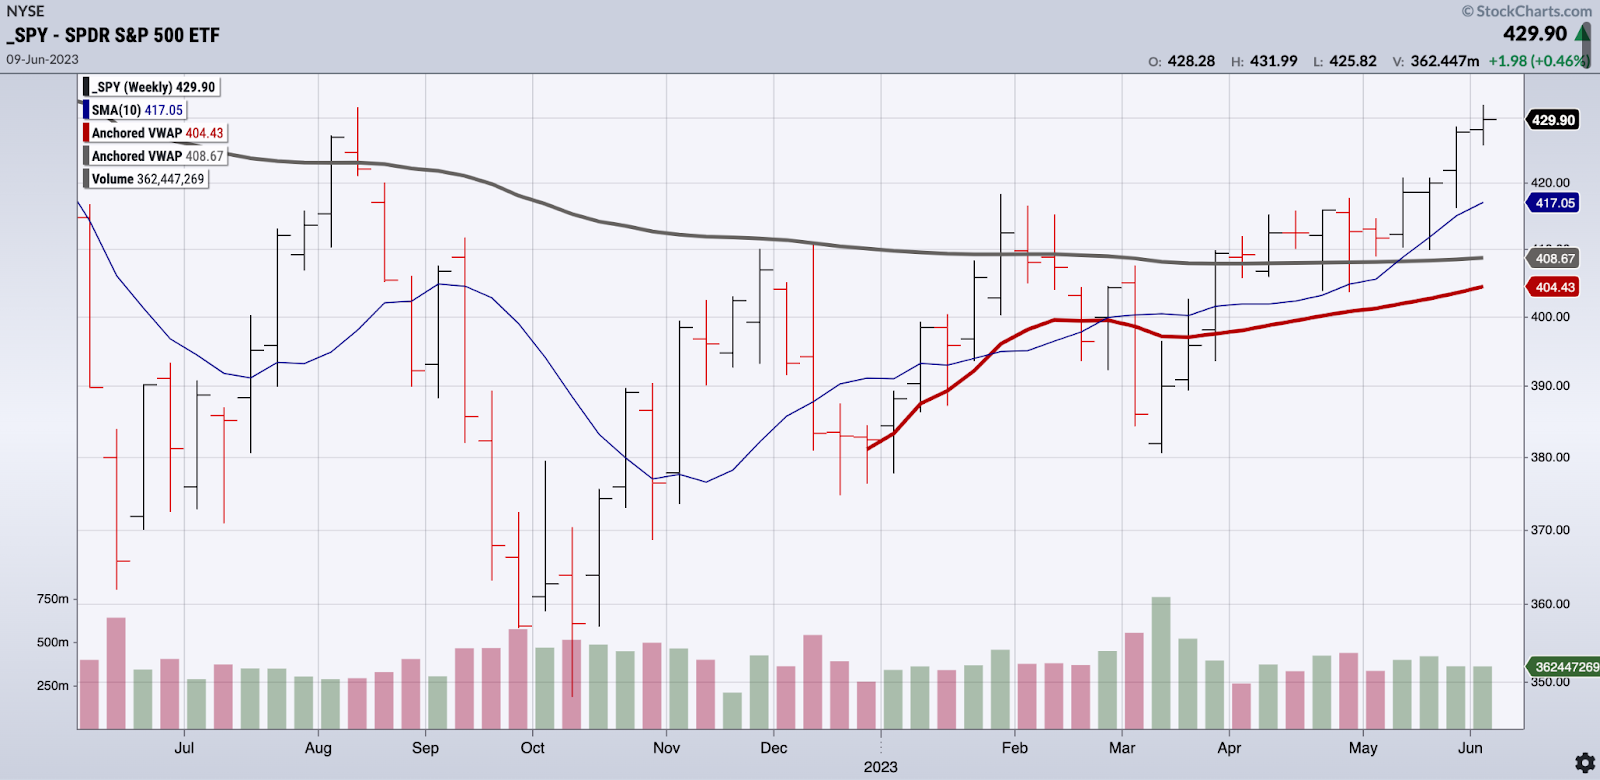
S&P 500 (SPY)
Below is the same chart view for SPY as we had for IWM above. The 10-week moving average is above the YTD AVWAP and the index is now trading comfortably above the cumulative average price since the index’s all time high last year.
The two AVWAP lines are very close, which is important from a psychological perspective. This means many investors who bought in earlier and rode the markets down have now had plenty of time to sell at near-breakeven. The fact that SPY has continued to trade above this line is very bullish from a technical perspective. But we would like to see the equal weight index confirm in order to feel more confident about the uptrend.
Market Sentiment
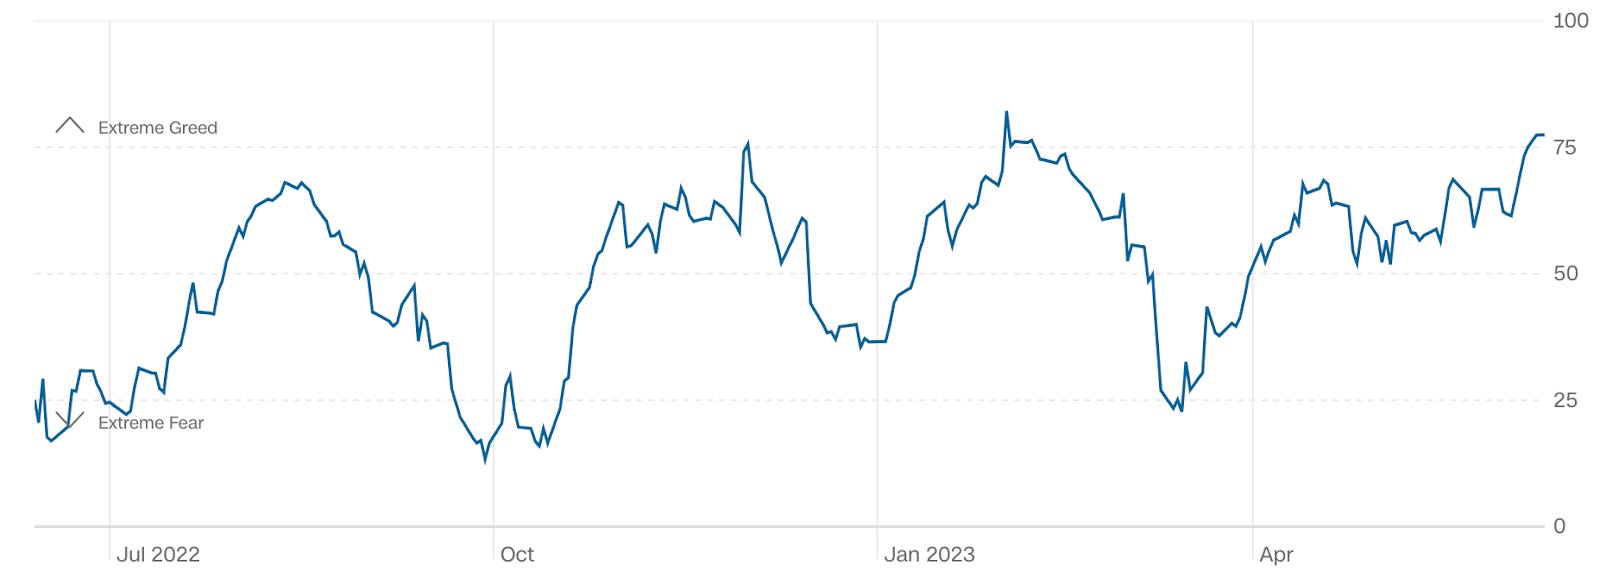
The CNN Fear & Greed Index is now at 77, which corresponds to extreme greed. Major reversals typically occur with readings above 80 and below 20. So the current reading is consistent with our view that a correction is likely sometime in the next month.
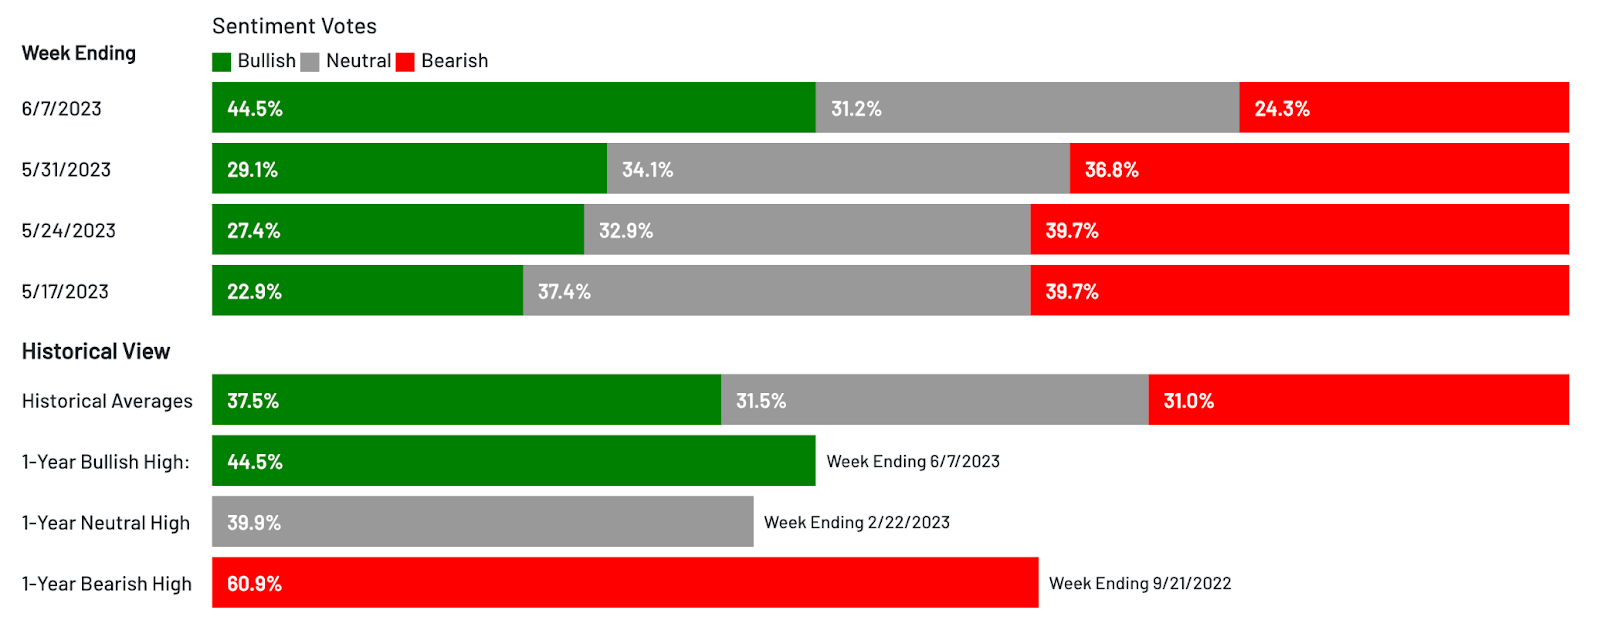
There was also a huge jump in bullish sentiment in the AAII Investor Sentiment Survey. 44.5% of investors surveyed think stocks will rise over the next 6 months, the highest reading since November 2021. Coming out of the Covid bear market, there was more skepticism for a prolonged period of time. Given the sudden optimism and that June is seasonally weak for stocks, the market is overdue for a correction.
The bottom line: Price and volume action for SPY and QQQ are very bullish. But given that DIA and IWM are near resistance, and we’re seeing near-extreme sentiment readings, we think the market is due for a correction soon. This week we will wait until after the inflation data and Fed meeting to add any positions to the portfolio.