
Market Brief - June 4, 2023
A number of positive developments last week indicate that this bullish trend has more room to run over the short term:
The strength of the labor market continues to defy expectations. Job openings and nonfarm payrolls were up. Though jobless claims were up slightly, they remain well below the long term average.
The debt ceiling drama is behind us.
Most of the Q1 earnings results are in and 78% of the S&P 500 companies delivered EPS beats.
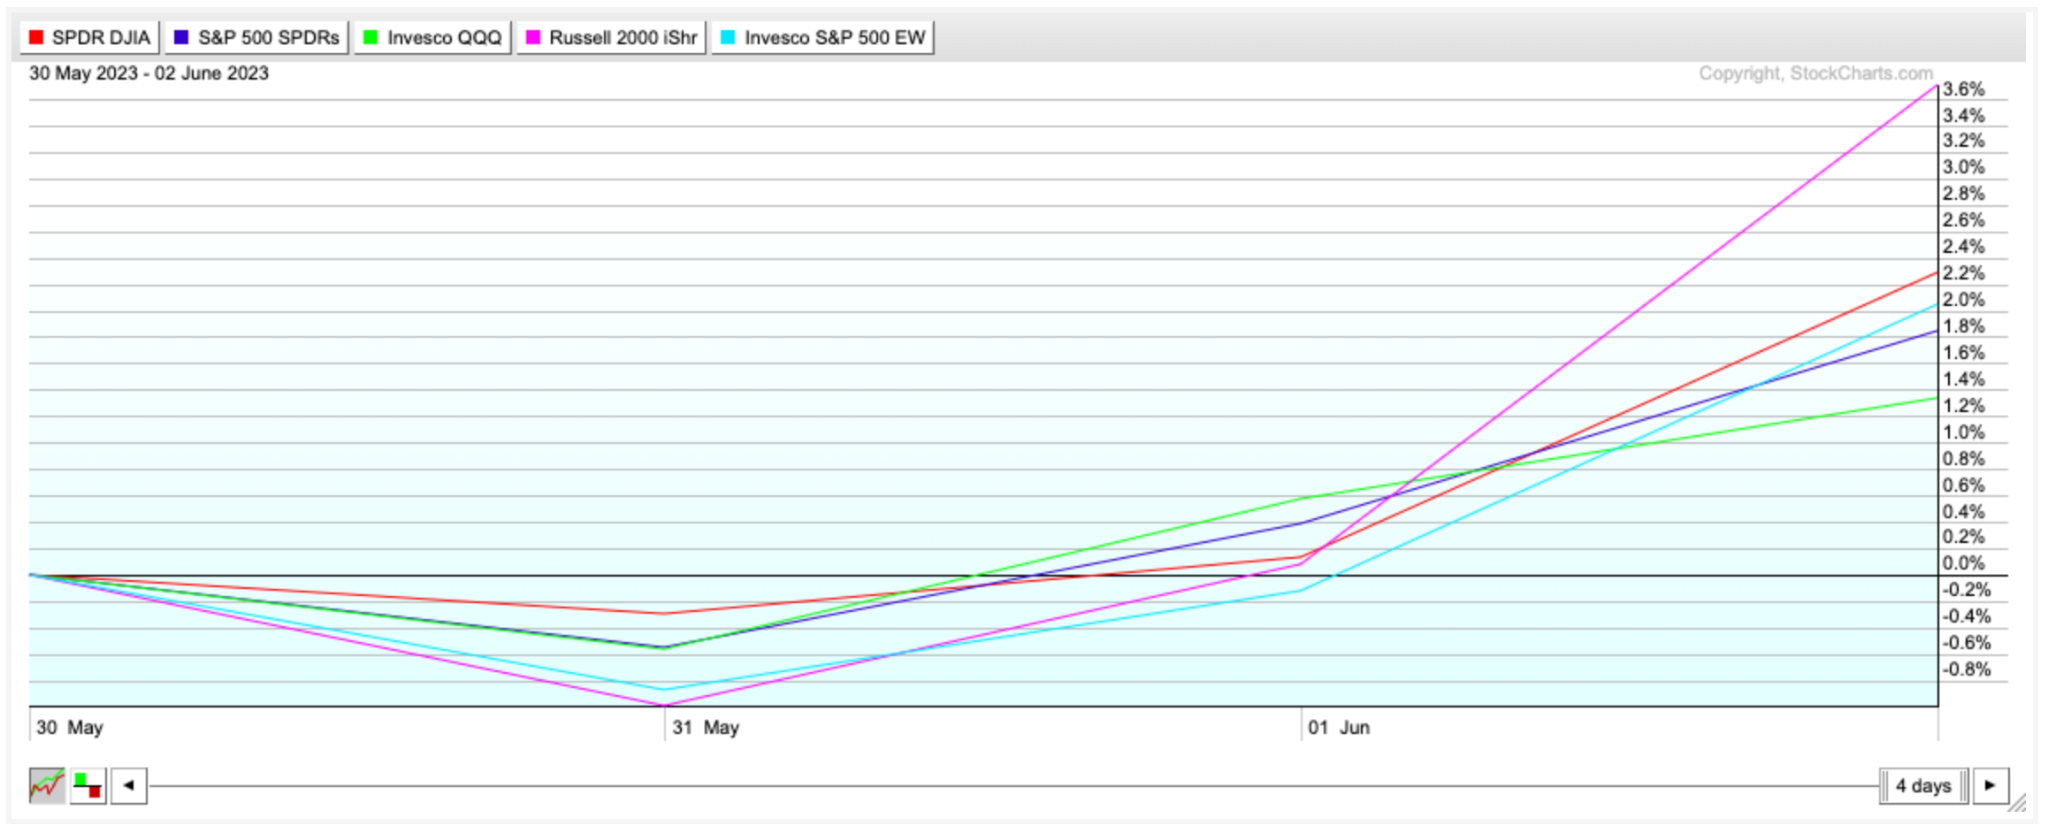
Market breadth is starting to improve, with the key market indexes delivering solid gains despite a short trading week (chart below). Additionally the S&P 500 Equal-Weight ETF (RSP) was up 2% for the week. Though it still has a long way to go to confirm the market-cap weighted S&P 500’s advance, the broad participation last week lends more credibility to this rally.
This rally will likely continue through mid-June, when the focus will turn to the next inflation report on June 13th and the Fed’s interest rate announcement on June 14th. As we said last week, June is historically a weak month for stocks. We added a stock to the portfolio last week and may add another next week, but will wait until after June 14th to get more aggressive.
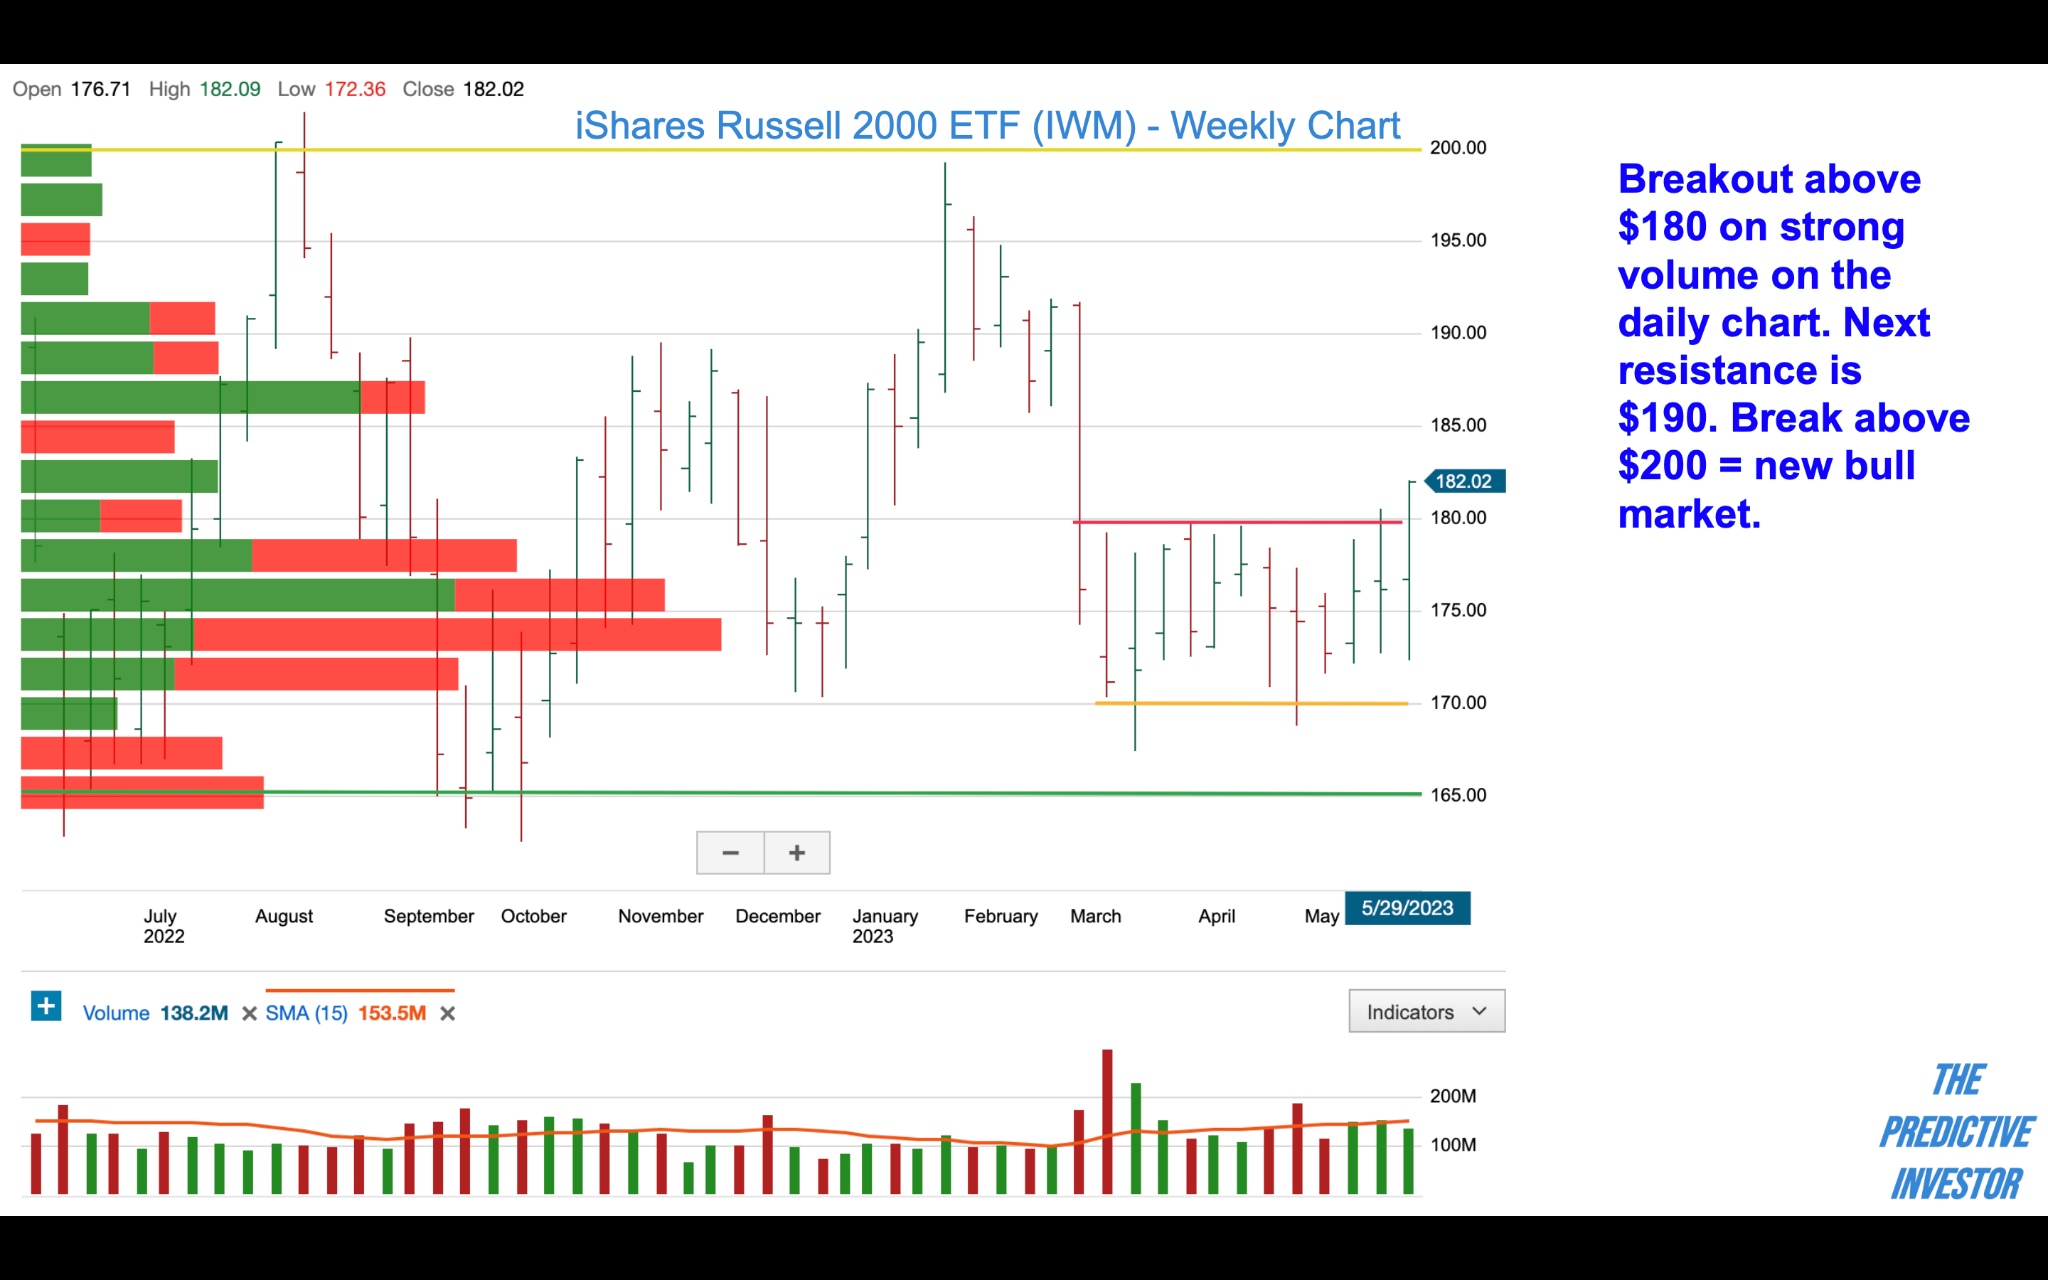
Russell 2000 (IWM)
IWM finally broke out of its nearly 12-week trading range, with a 60% increase in volume on the daily chart. Very little resistance until $190, and a break of $200 would confirm a new bull market.
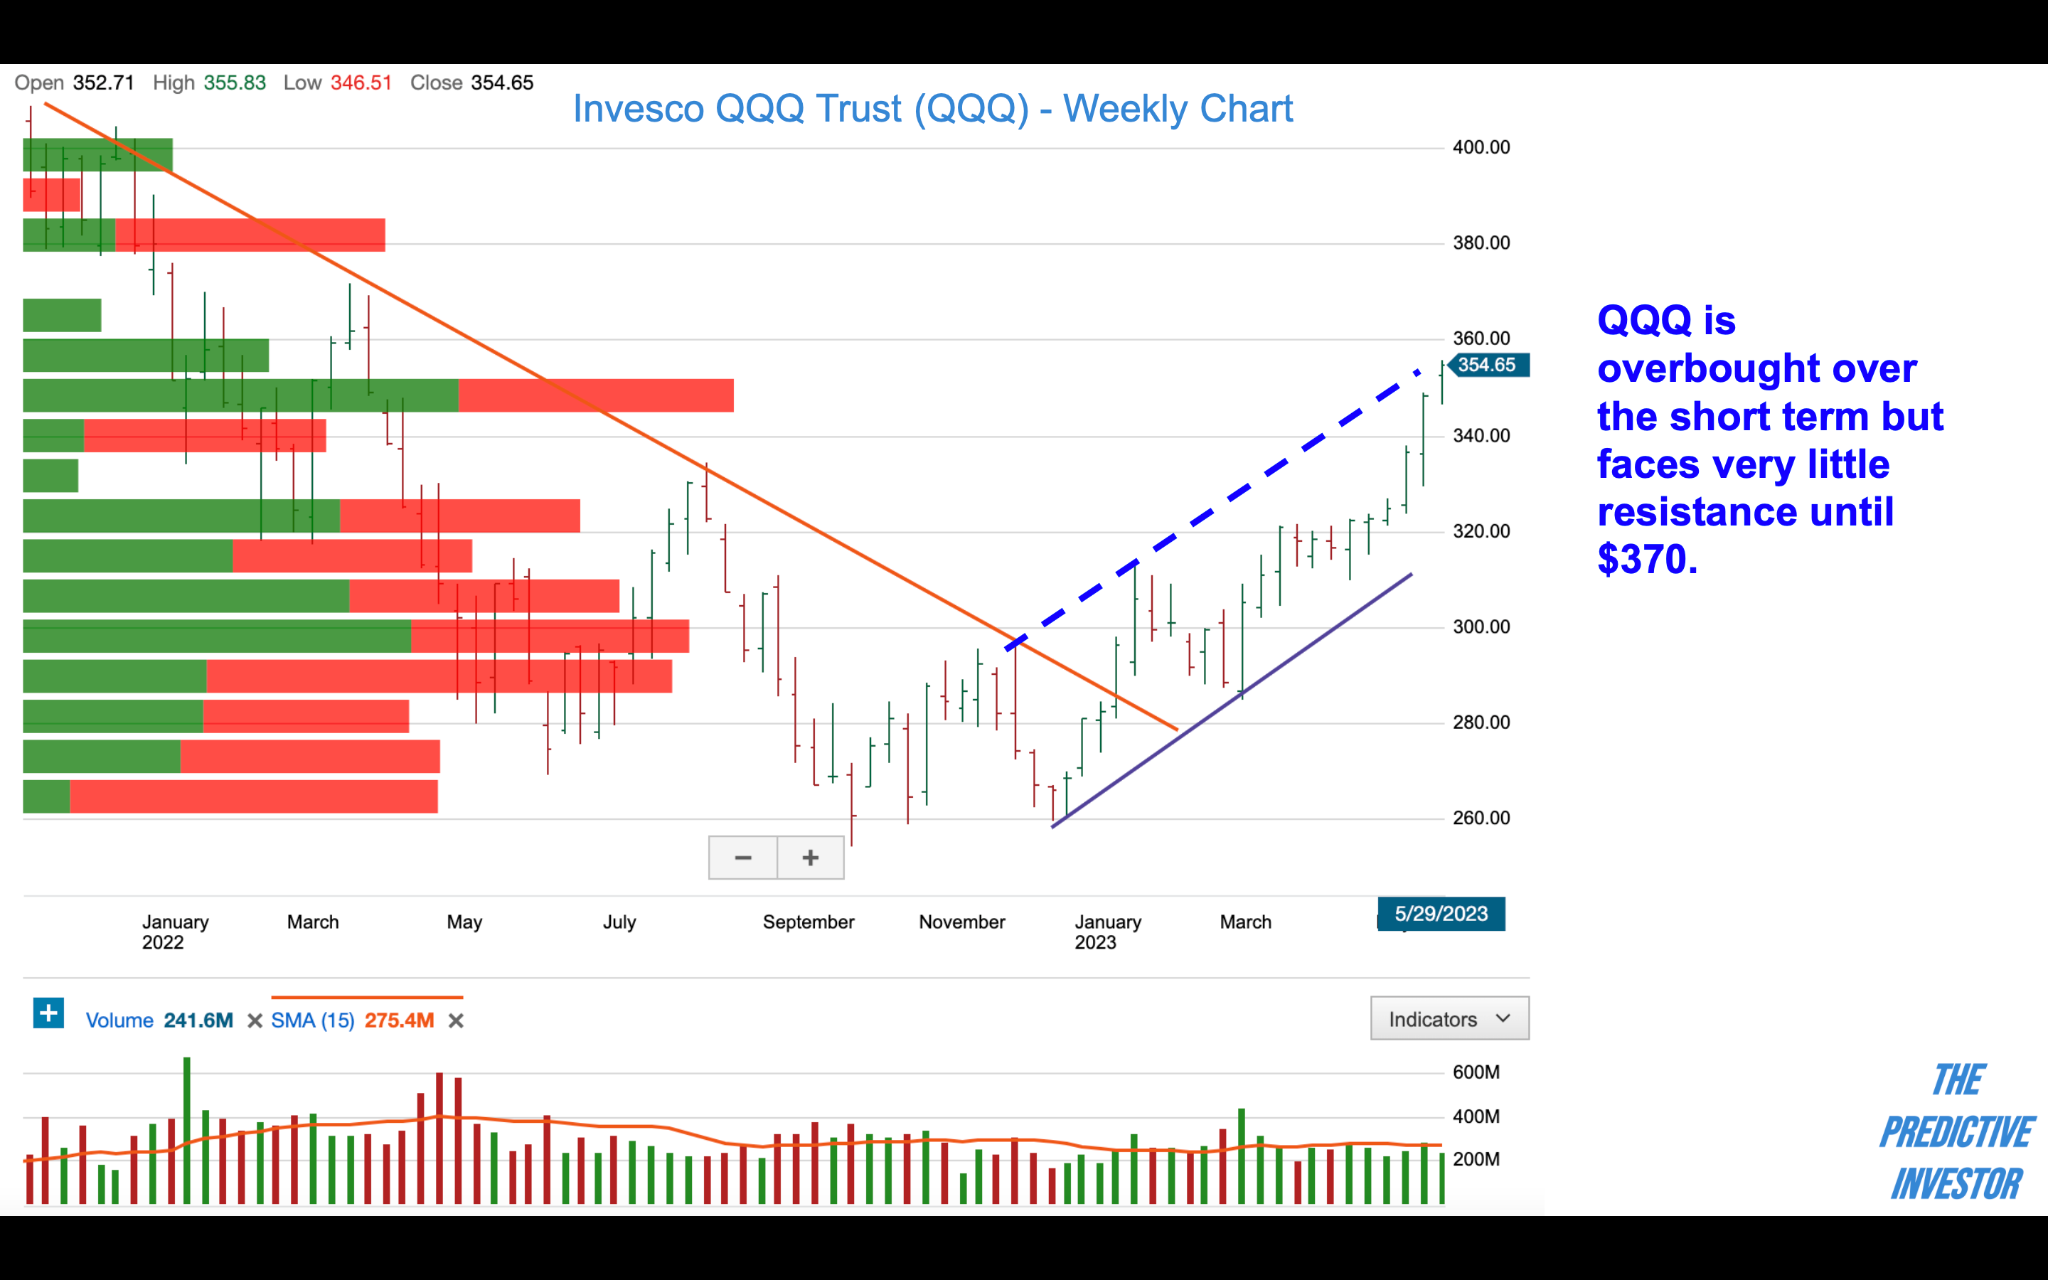
Nasdaq (QQQ)
The market has been repricing a number of companies based on their ability to leverage AI as a growth channel, which has been very good for mega cap tech stocks that drive the QQQ. The index is at the upper end of a 5-month trend channel (see chart below) and is overbought over the short term, indicating that a short-term pullback is likely mid-late month.
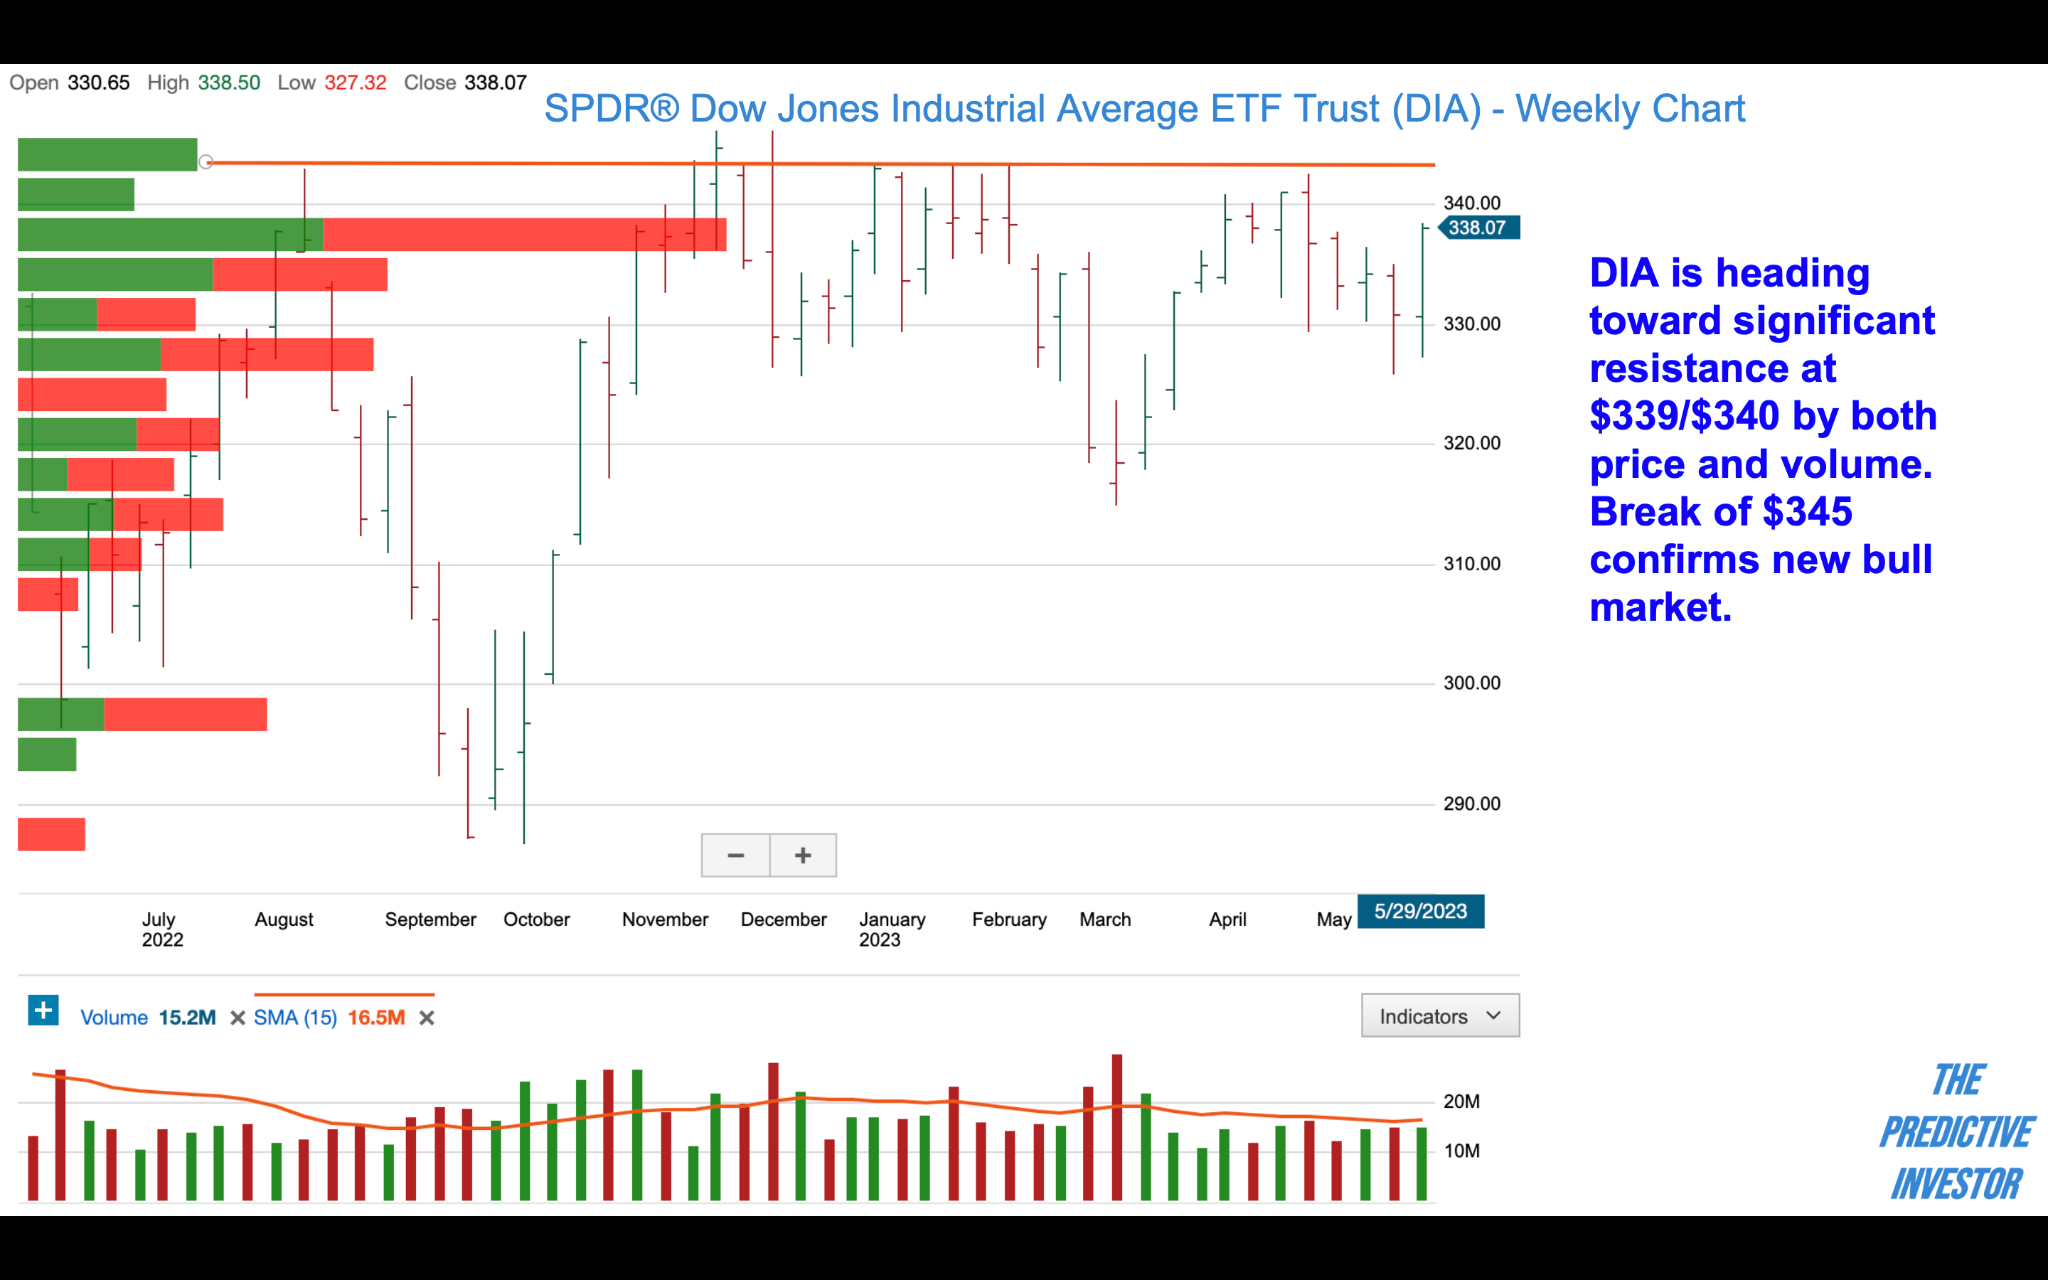
Dow Jones Industrials (DIA)
On Friday DIA closed up 2% on an 81% increase in volume from Thursday, but is once again approaching a price area that has served as strong resistance over the last 10 months. A breakout of $345 will confirm a new bull market.
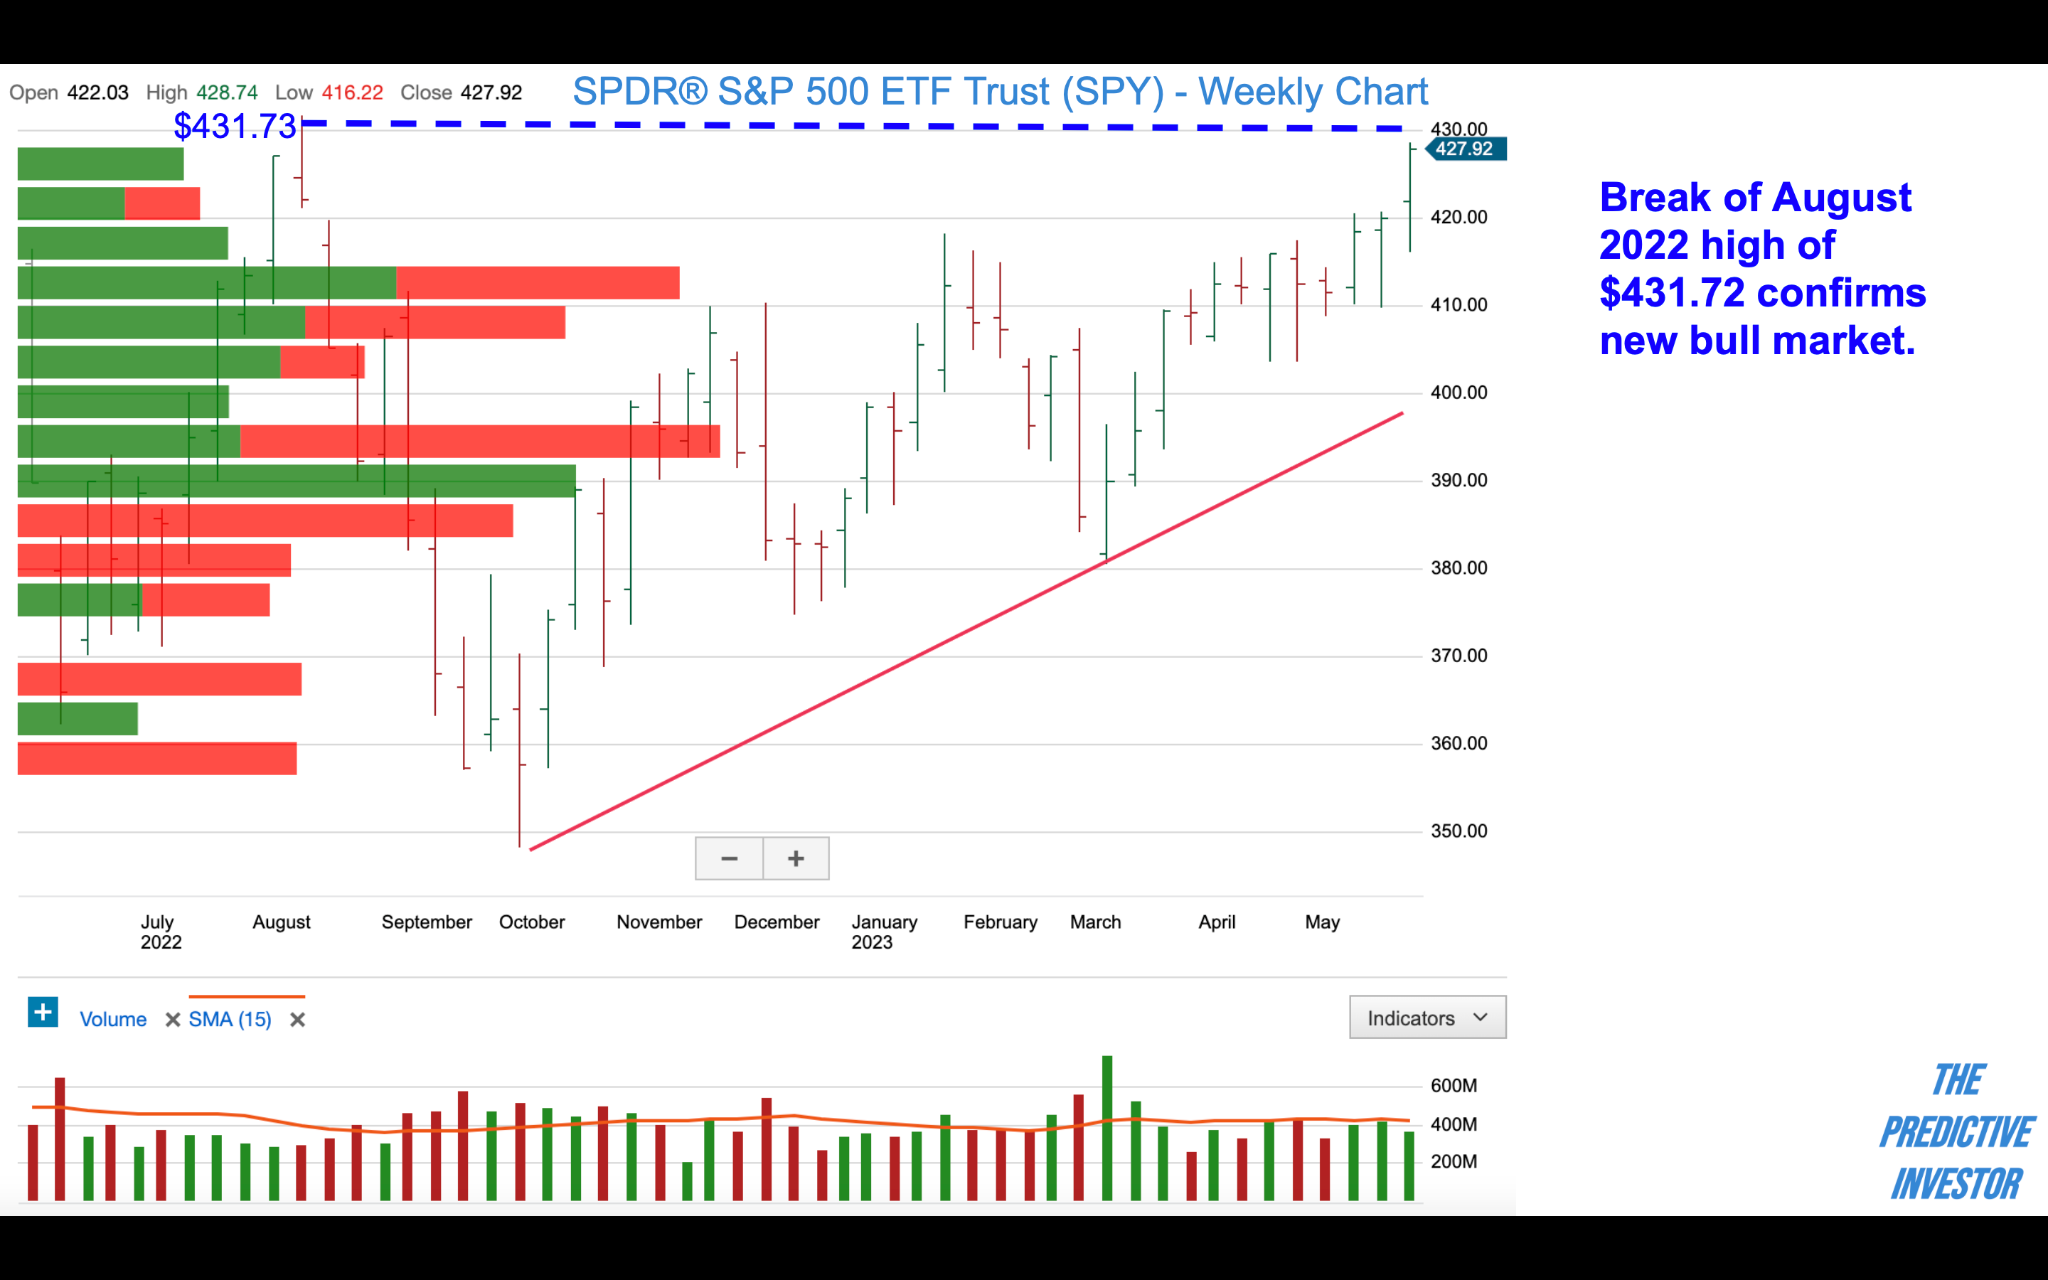
S&P 500 (SPY)
SPY is very close to confirming a new bull market. Though breadth is improving, the equal-weight ETF is still about 10% below its August 2022 high.
Market Sentiment
As the famous Buffett saying goes, it pays to be fearful when others are greedy, and greedy when others are fearful. We use market sentiment as a contrarian indicator, as key turning points occur when greed/fear is at an extreme.
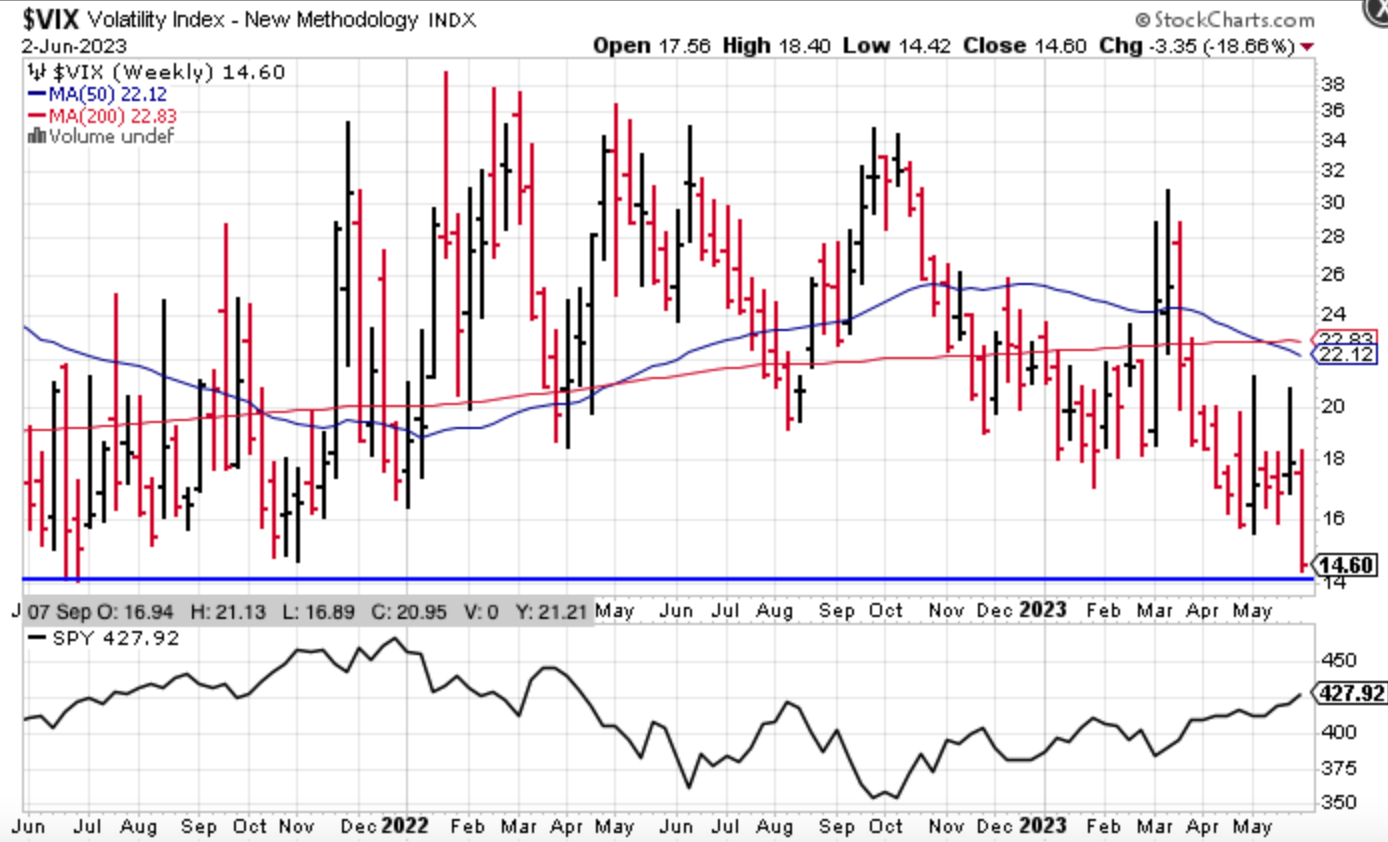
VIX - Greed
VIX is at a 2-year low, continuing the downtrend from its March high. While this is bullish over the short term, it indicates an incredible degree of complacency among investors, setting the stage for a potential increase in volatility on any bad news.
Investor Sentiment - Neutral
The latest AAII Investor Sentiment Survey shows bullish sentiment increased 1.7% week-over-week, but still remains below its historical average. Bearish sentiment decreased 2.9% week-over-week, and remains above its long term average. Markets typically top with an extreme bullish reading, which suggests this rally has more room to run.
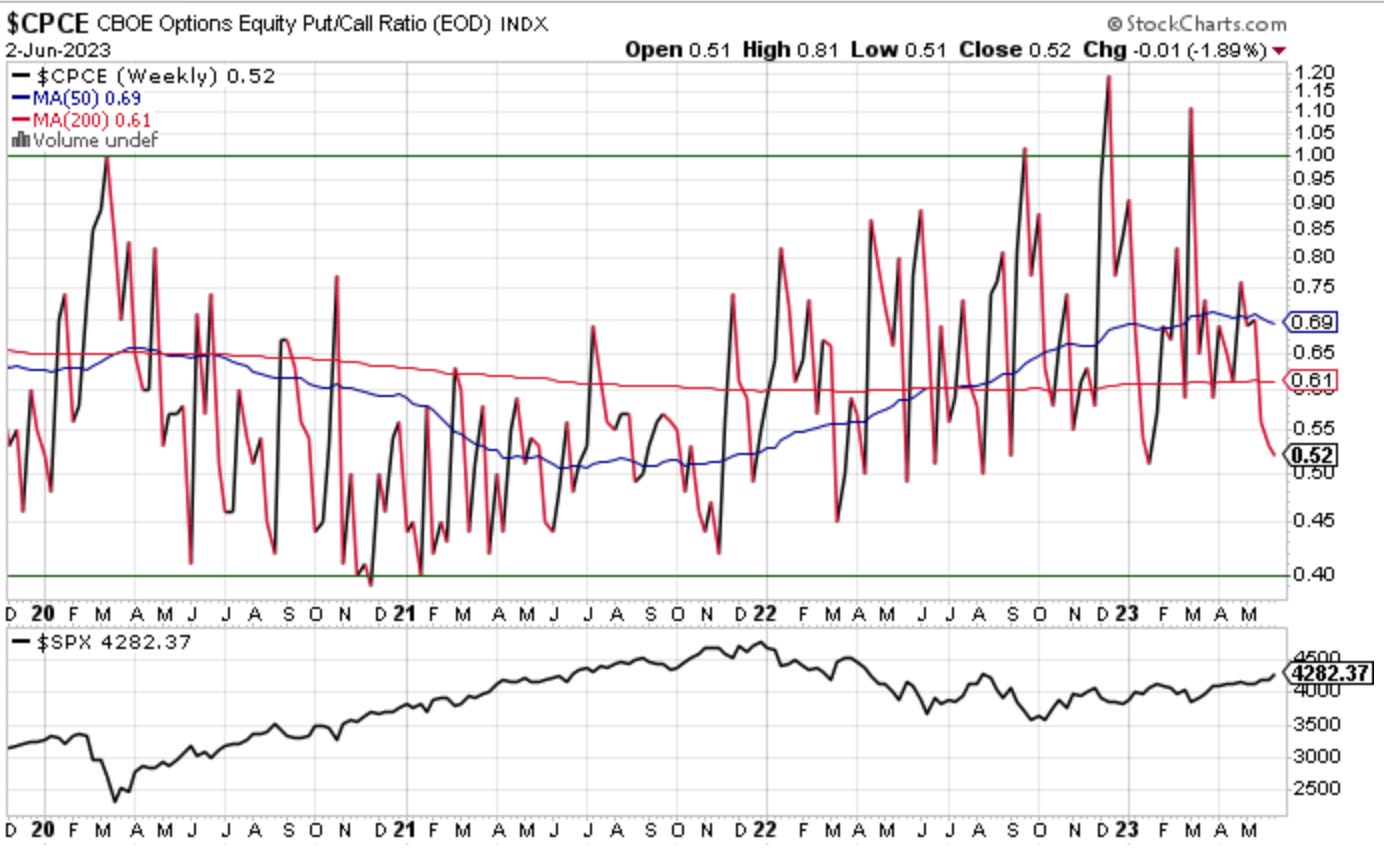
CBOE Equity Put/Call Ratio - Greed
The chart below shows the CBOE Equity Put/Call Ratio against the S&P 500. We are not quite at an extreme reading, but almost there. Bullish over the short term.
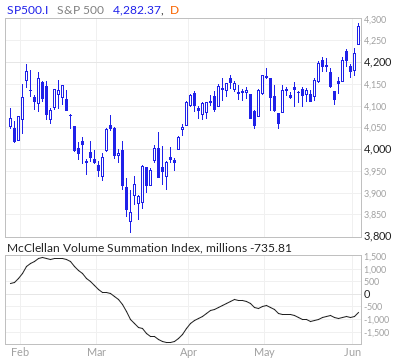
McClellan Volume Summation Index - Fear
Despite the rally, there is still more selling volume than buying volume in the S&P 500. Markets typically top with more buying volume than selling volume, suggesting this rally has further upside.
The bottom line: Market breadth is improving, suggesting that this rally will continue over the short term. However, we are heading into a historically weak month for the stock market, and would not be surprised to see a pullback mid-late June. We added one position to the portfolio this week, and may add another next week. But we will wait until after the inflation report and Fed rate announcements on June 13-14 before buying more aggressively.