Market Brief - May 14, 2023
Last week’s news delivered something for both the bulls and the bears to latch on to.
For the bulls: inflation continued to slow, which means a potential pause in interest rate hikes and the Nasdaq hit a new YTD high.
For the bears: the latest University of Michigan Consumer Sentiment Survey indicated a drop in sentiment, lending standards tightened, and the debt ceiling remains unresolved.
The insiders make money by shifting sentiment from greed to fear and back again, and the conflicting news means neither camp has control of the market. This week April’s retail sales figures will be released and jobless claims will be released Thursday. Neither of these are likely to significantly change market sentiment, which means continuation of the status quo - bearish divergence between tech and the rest of the market.
Russell 2000 (IWM)
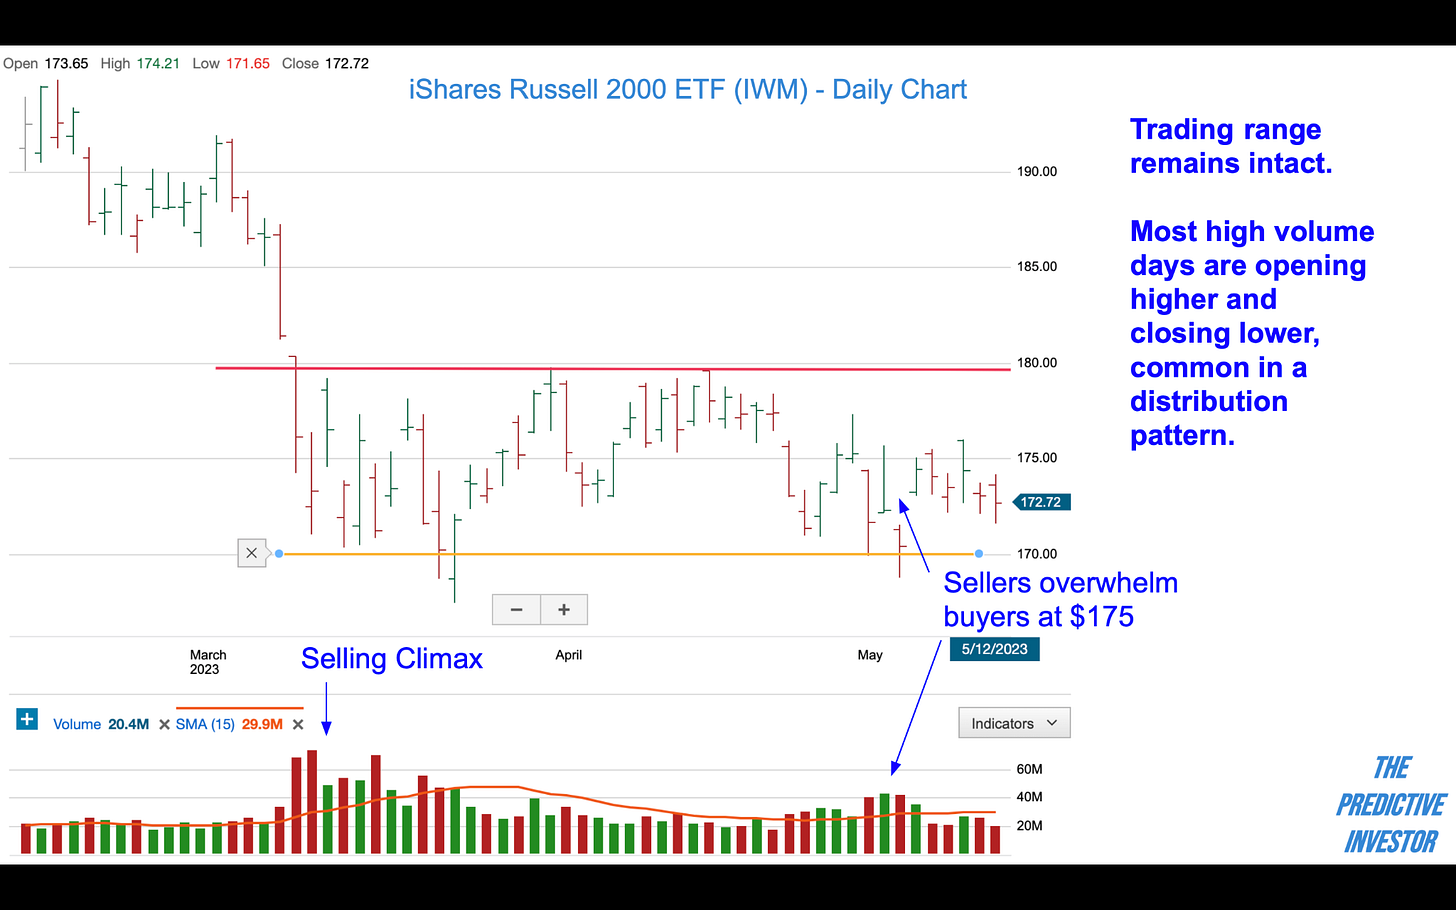
IWM remains in a trading range since the selling climax in March. While it does appear there’s been some accumulation of shares at $170, there is more selling volume at 175. Neither buyers nor sellers are in control of this market. We’ll be looking at price and volume activity at $170 and $180 for indications of a trend change. Until then we remain neutral.
Nasdaq (QQQ)
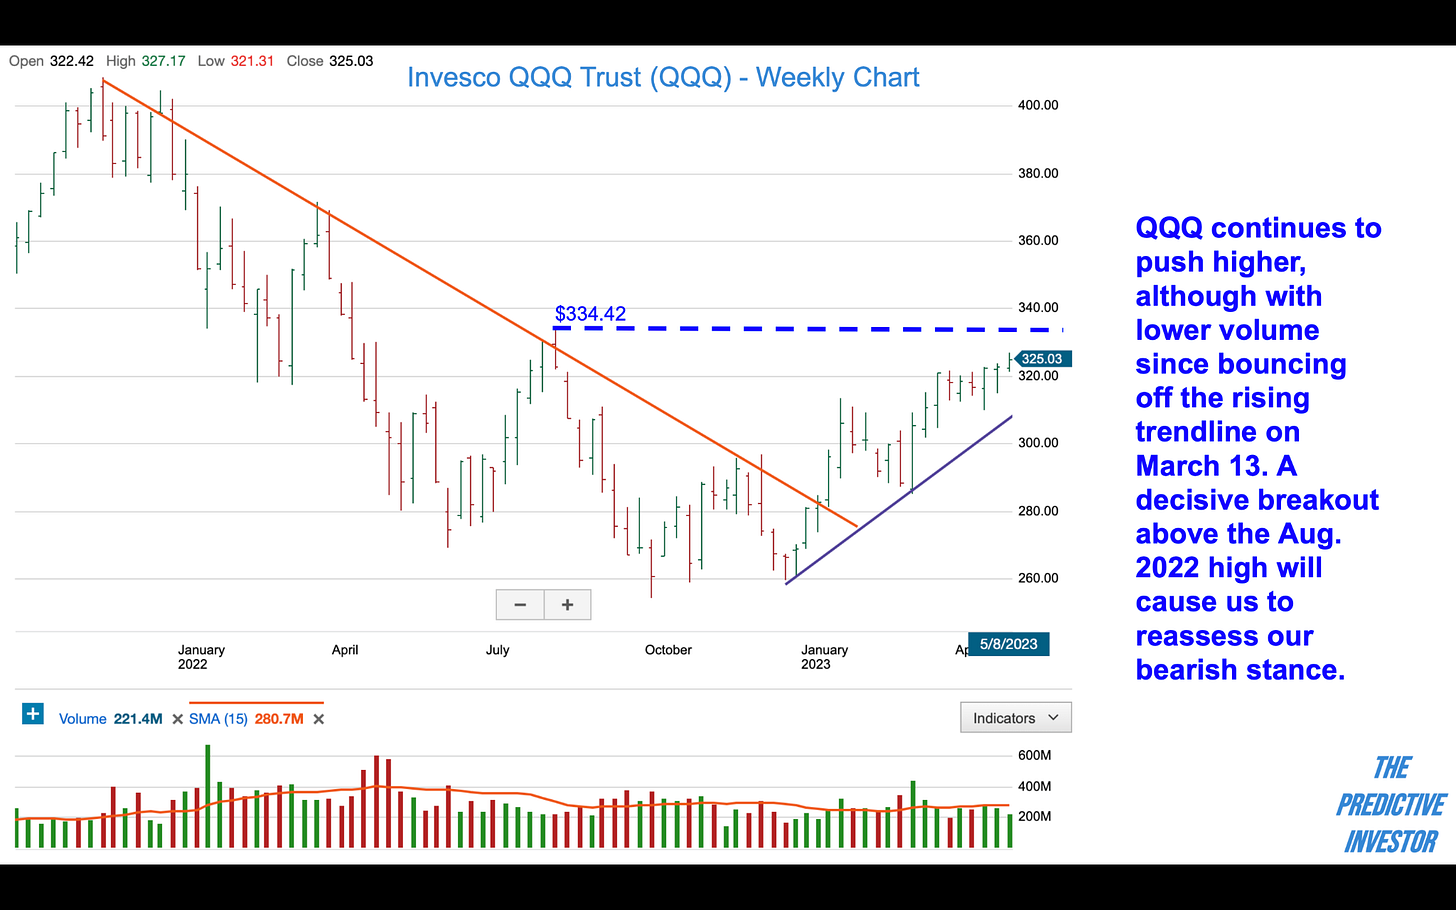
QQQ continues to push higher, and the real test will be if it can take out its August 2022 high of $334.42. The Dow briefly traded above its August 2022 high in December, but then failed to hold it. SPY has not yet traded above its high of last summer.
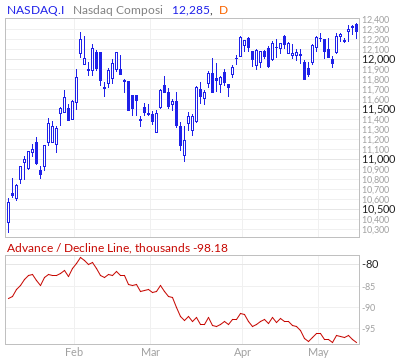
Here’s the reason we remain cautious: as the Nasdaq hit a 6-month high this week, the index’s Advance/Decline line hit a 6-month low. A rally driven by fewer and fewer stocks cannot continue for long.
Dow Jones Industrials (DIA)
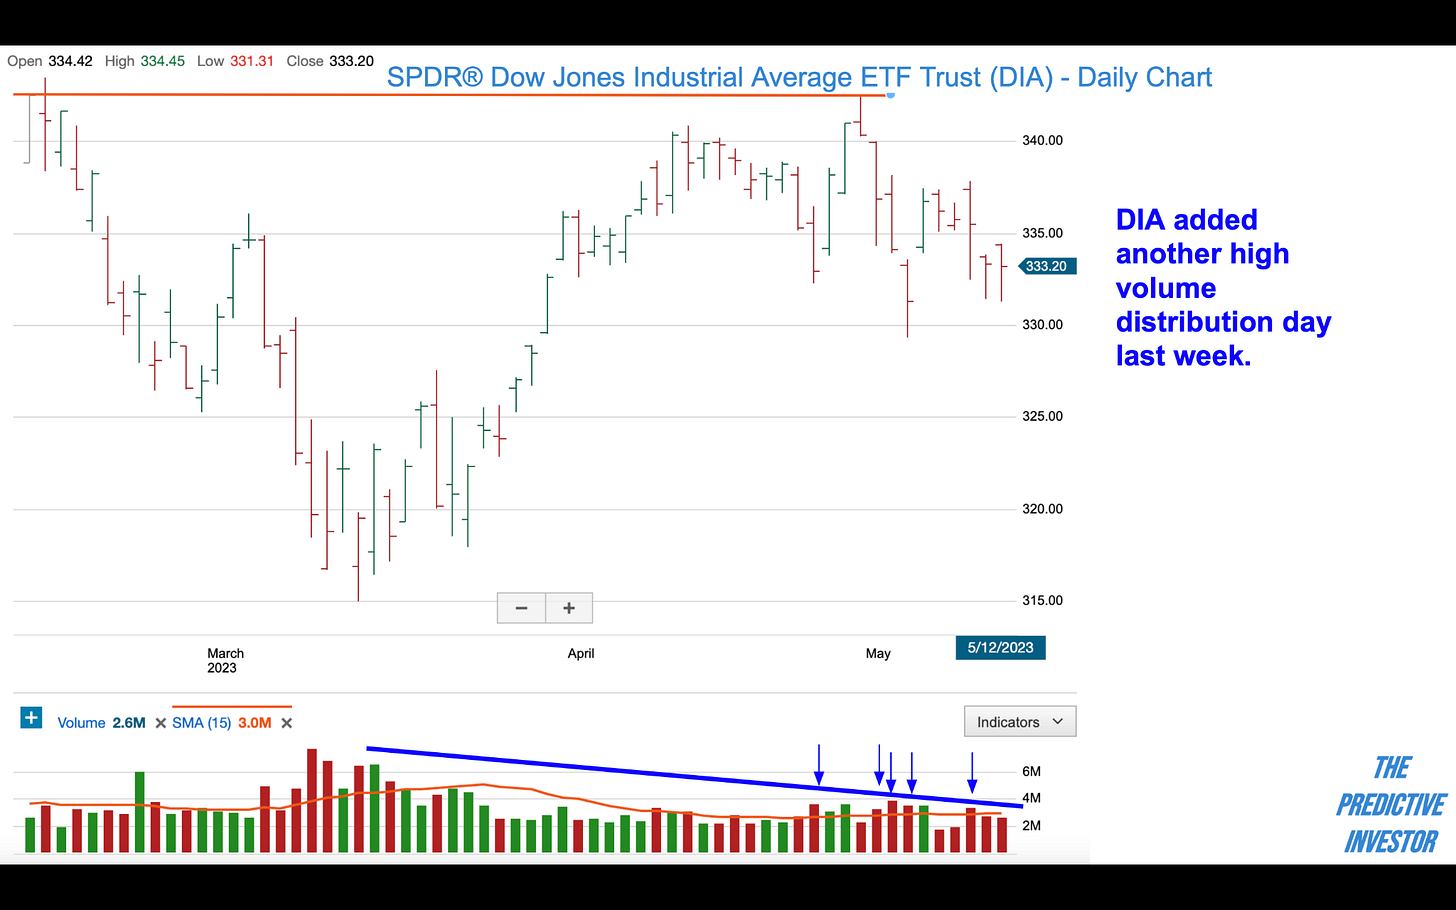
While the Nasdaq is slowly working its way higher, the Dow is slowly working its way lower. DIA added another high volume distribution day last week, and more Dow stocks are breaking down than making new highs. A breakdown below $330 will confirm the long-term bearish trend remains intact.
S&P 500 (SPY)
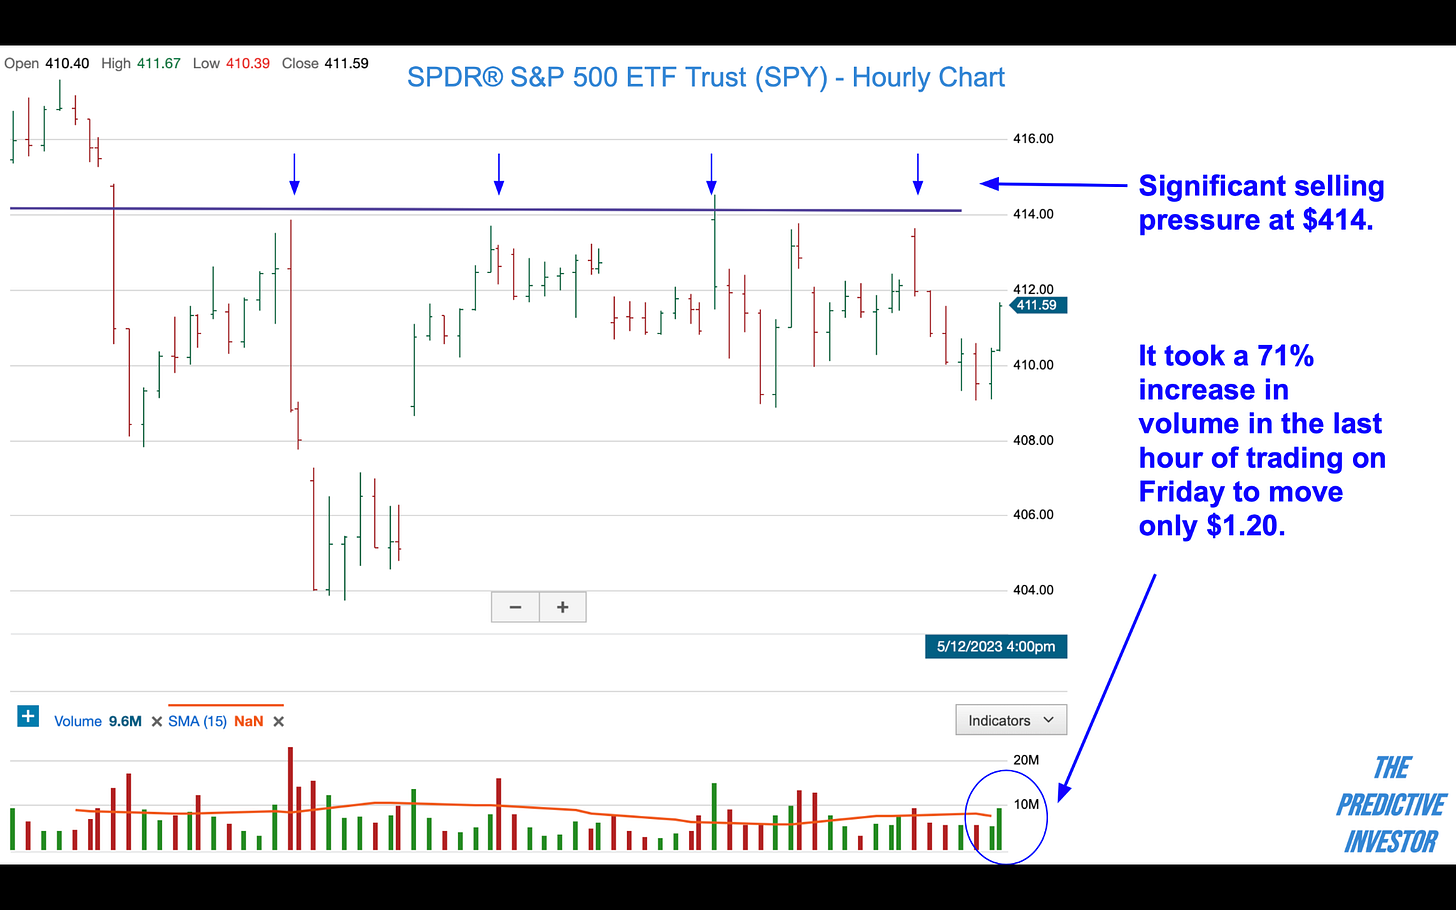
SPY was virtually unchanged for the week. Though we typically use daily and weekly charts to assess the market, during periods of divergence it’s often useful to shorten the time frame for additional context. The hourly chart for SPY shows significant selling pressure at $414 during the first 2 weeks of May. During the last hour of trading on Friday, it took a significant jump in volume to move the ETF just over a dollar. This is more indicative of an impending correction than a breakout.
Market Sentiment
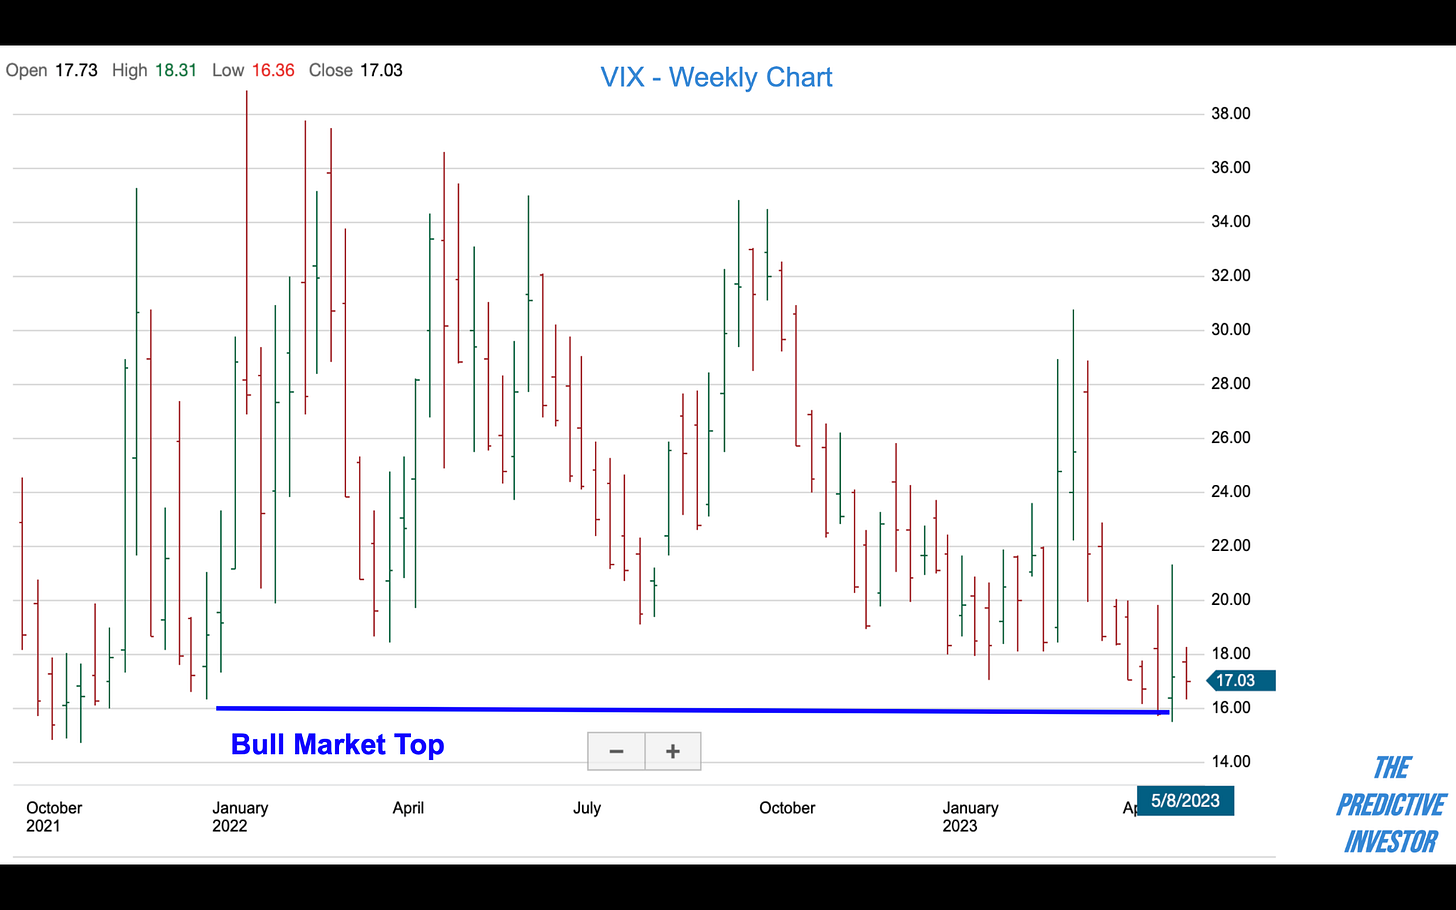
VIX closed the week at 17.03, not much higher than its YTD low and well below its 40-week moving average of 22.21. Against the backdrop of slipping consumer sentiment and uncertainty on the debt ceiling, this level of complacency is surprising.
The last time the U.S. came close to a default was back in 2011, and the VIX hit a high of 48 that summer as a deal was finalized just before the deadline. Complacency combined with bearish divergence in the market indexes leads us to believe there’s more risk to the downside at this point.

