Market Brief - September 3, 2023
Welcome to The Predictive Investor Market Brief for September 3rd, 2023!
Stocks were up strong this week on signs the labor market is softening. Job openings and quit rates are falling, year-over-year wage growth is softening, and the unemployment rate increased. This all suggests the Fed is likely to keep interest rate hikes on pause, which paves the way for further upside to equities.
Weekend Reads
A Default Cycle Has Started: The reality is that more and more companies are defaulting because the cost of capital is higher, and Fed Chair Powell says that interest rates will stay at these levels “for a couple of years,” so tight monetary policy will continue to have a greater negative effect on the economy and capital markets. (Apollo)
Oil’s historic price surge in 2008 will look like ‘child’s play’ compared with the expected copper boom by 2025, Citi says: Copper’s critical role in electric vehicle batteries and other green energy technologies has led some to call it “the new oil.” The metal is used in solar panels, wind turbines, electrical cables, and even your iPhone. In fact, copper is so widely used in construction, manufacturing, and electronics production that it’s often seen as a proxy for global economic activity and a business cycle indicator, earning it the nickname “Dr. Copper.” (Fortune)
We are bullish on commodities, and while we have several energy stocks in our portfolio, there’s fewer ways to play a bull run in copper in the micro cap universe. For investors looking to bet on this, we like Southern Copper (SCCO), the largest holder of copper reserves in the world.
Is Nvidia the Next Cisco? 231 companies have reached a similar multiple over the last 50+ years, according to Jeremy Schwartz. Only 20% of stocks trading with a P/S ratio between 30-40 outperformed the market over the next 12 months. The more you extend your time horizon, the worse the results get. Over a 10-year period, that number drops down to 6%. (The Irrelevant Investor)
Market Technical Analysis
S&P 500 (SPY)
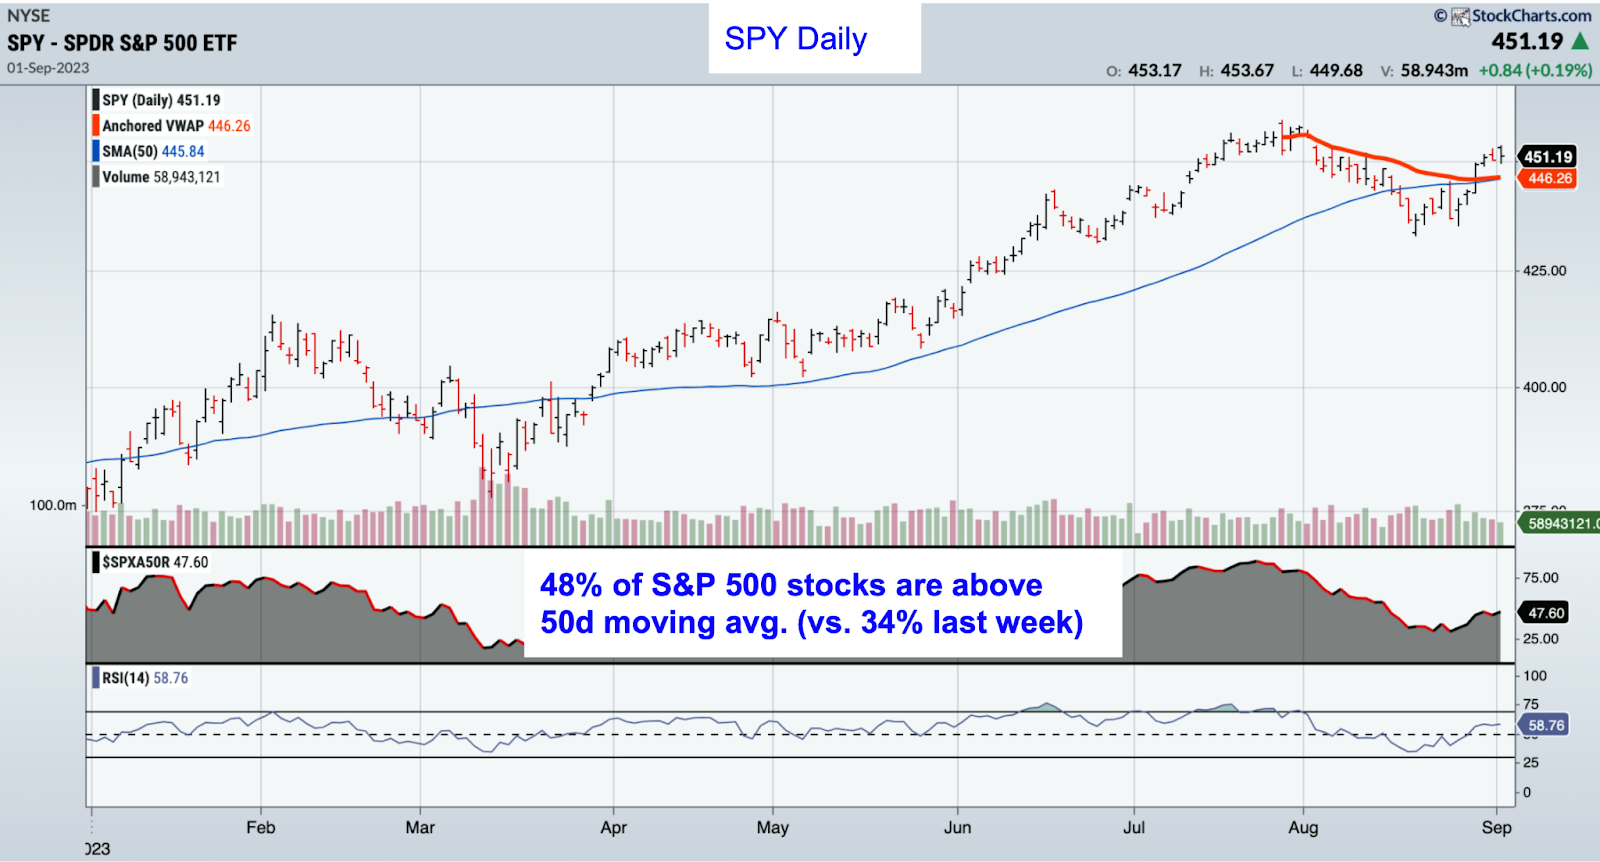
For the most part the indexes all look similar from a technical perspective: price has retaken its 50-day moving average, the percentage of S&P 500 stocks above their 50-day moving average is trending up, and momentum indicators are also trending up (on the daily chart). SPY is comfortably above the 7/27 AVWAP (July high), which is starting to flatten out. The fall is typically a volatile period for stocks, so we may have been premature in our trades last week, but it does appear that the market wants to test the July highs at the very least.
Market Sentiment
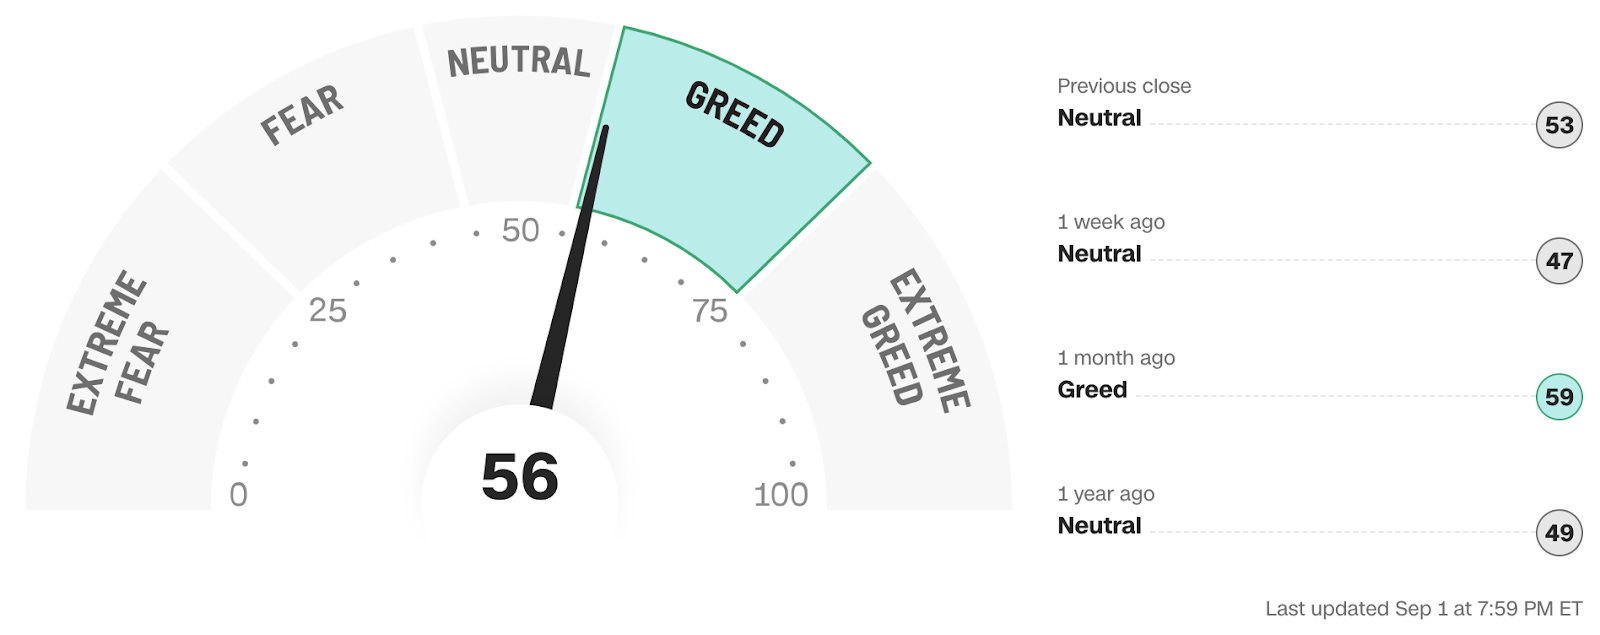
Recent price momentum is backed by a shift in sentiment, with the CNN Fear and Greed Index moving back into Greed territory after being Neutral for the last 2 weeks.
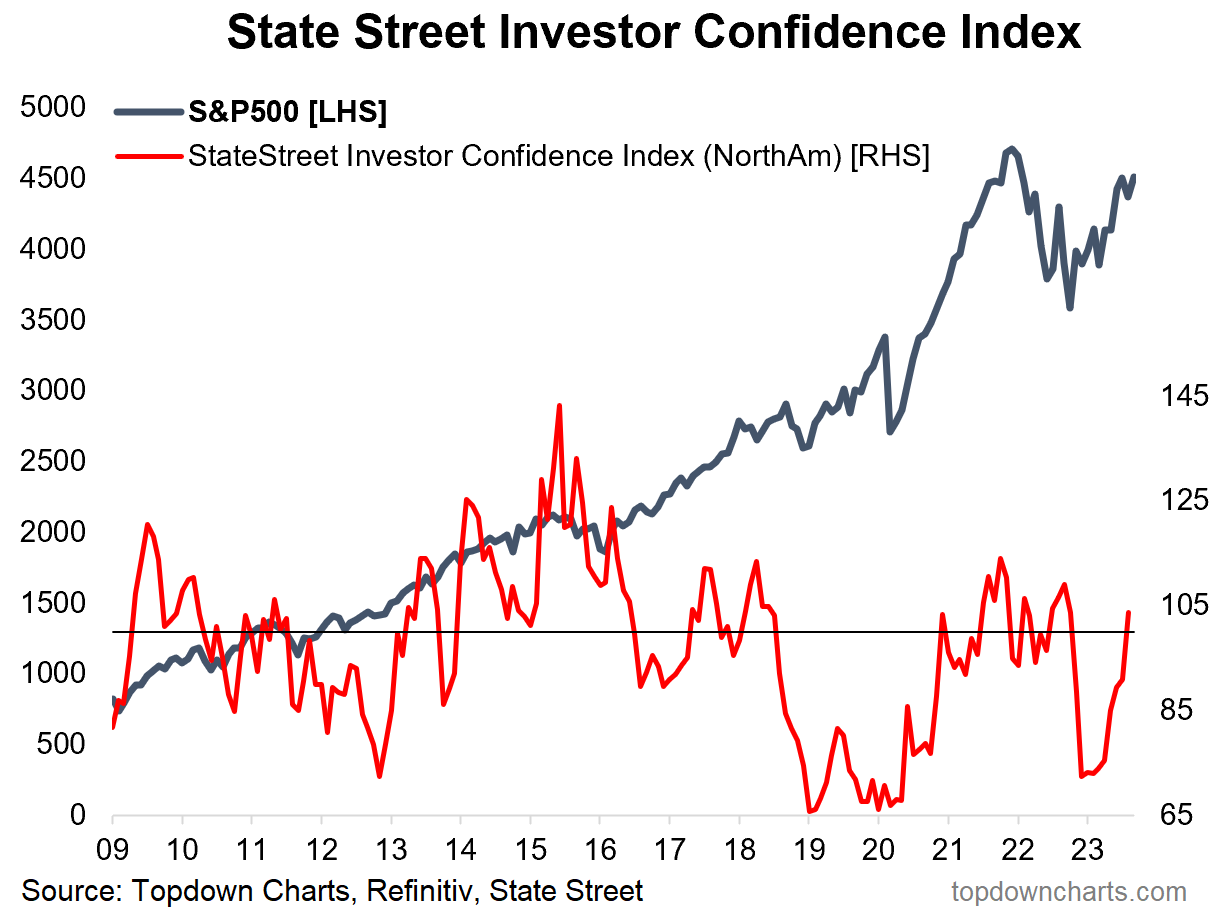
We’re also seeing institutional investors in North America increase equity exposure (chart below). Based on buying and selling patterns, readings over 100 mean institutions are increasing exposure to risky assets. Institutions are net bullish for the first time this year. This along with increased company share buybacks means the fall correction may be less severe than expected.